
Query Store is becoming more and more important for server monitoring, specially in SQL Server 2017, which allows us to get historical information about wait stats.
We can import query store information into power bi and create a very useful dashboard to monitor SQL Server. Query Store tables are system tables, due to that we can’t visually select those tables, power bi doesn’t show system tables.
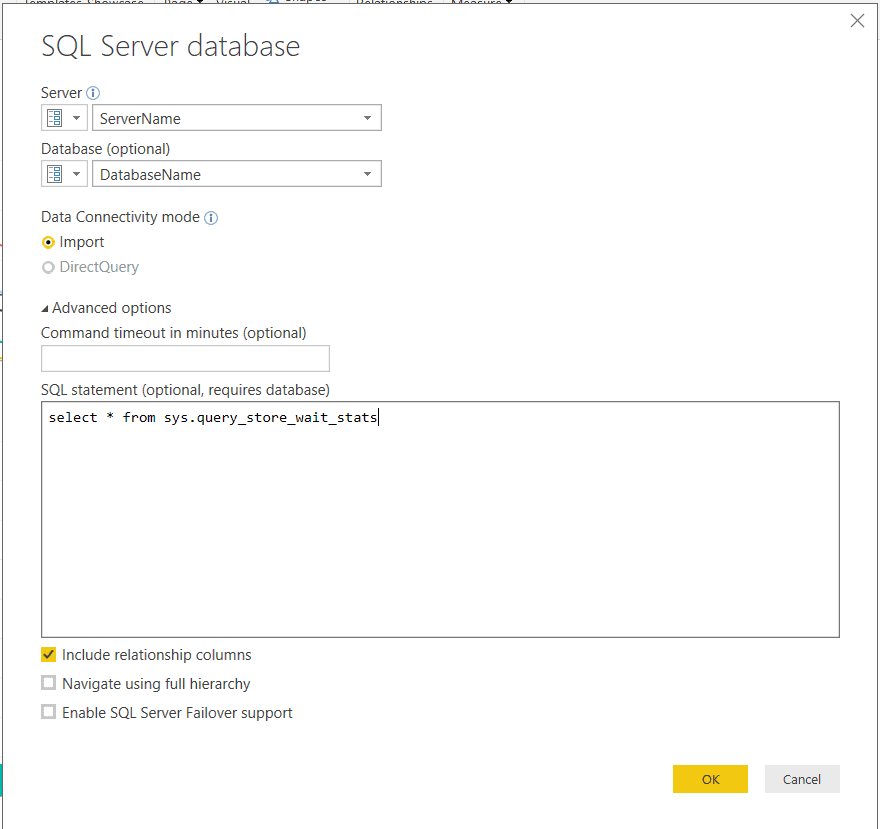
The solution is to use ‘Advanced Options’ in ‘SQL Server Database’ window and fill the ‘SQL statement’ field with a query against query store system tables.
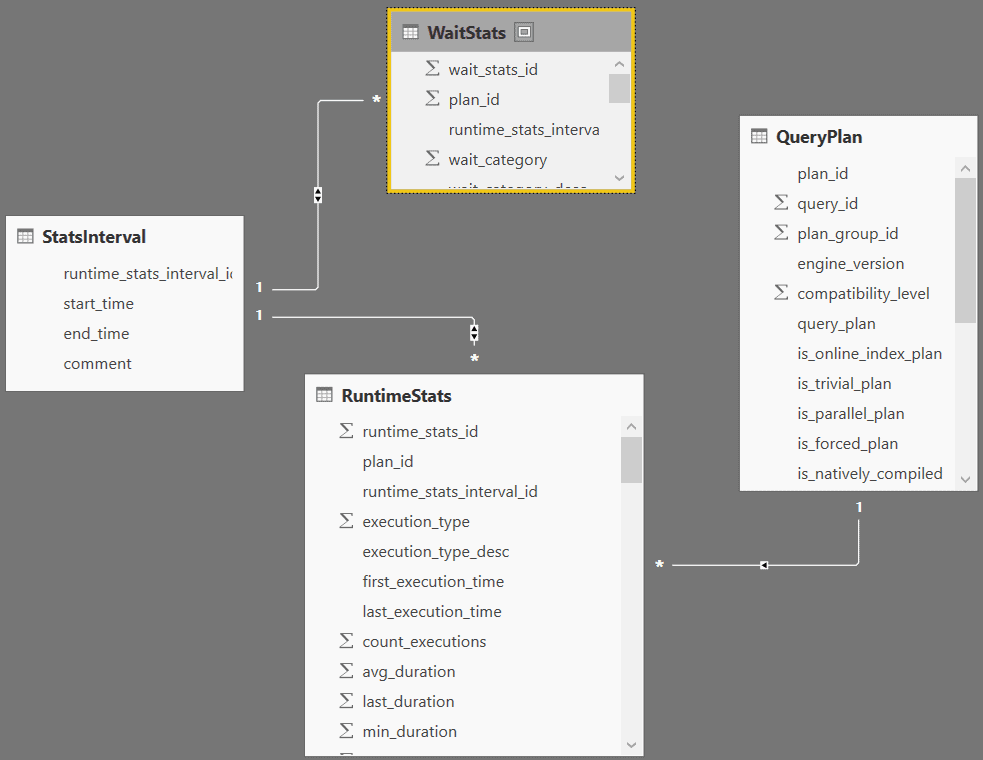
I built the model with four query store tables, as you may notice in the following image:
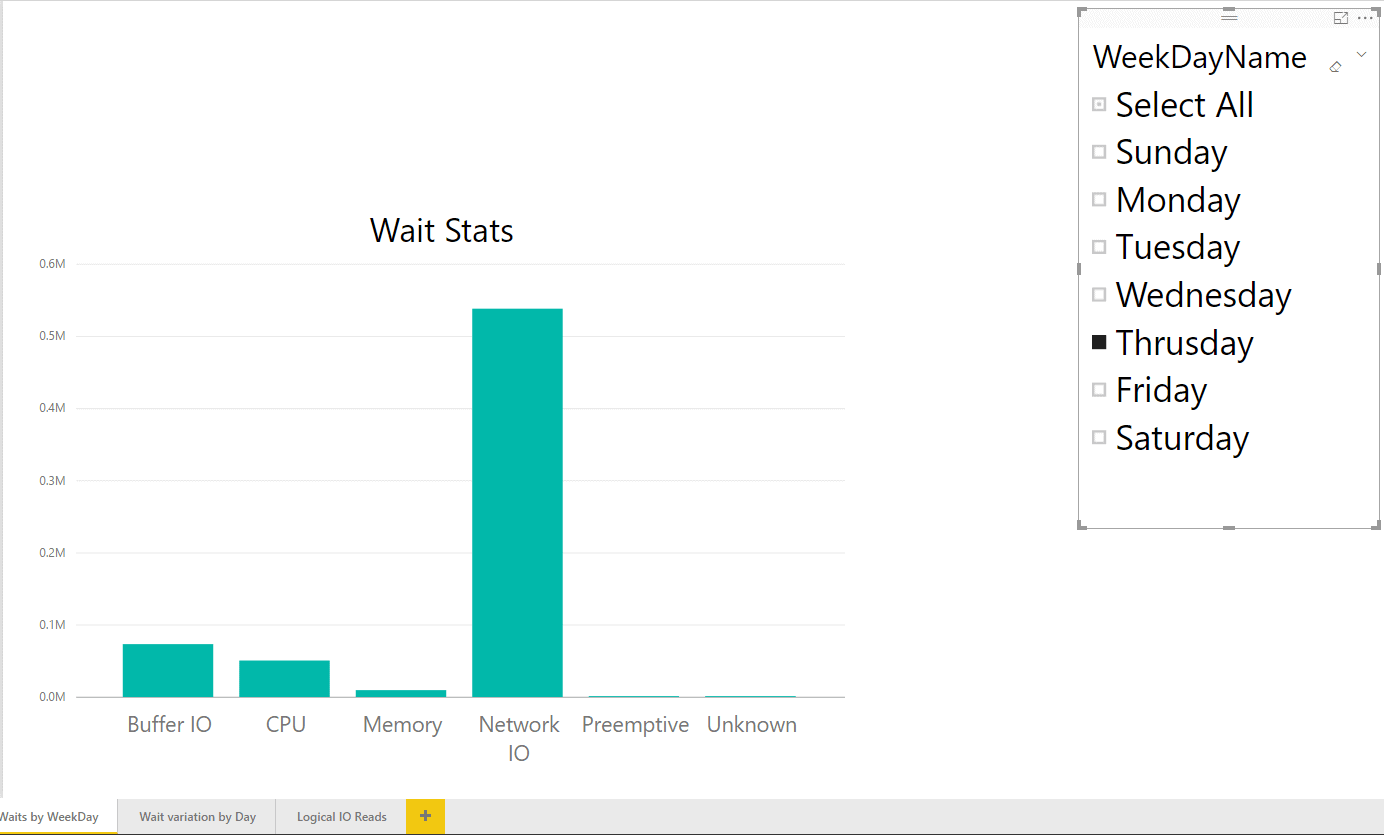
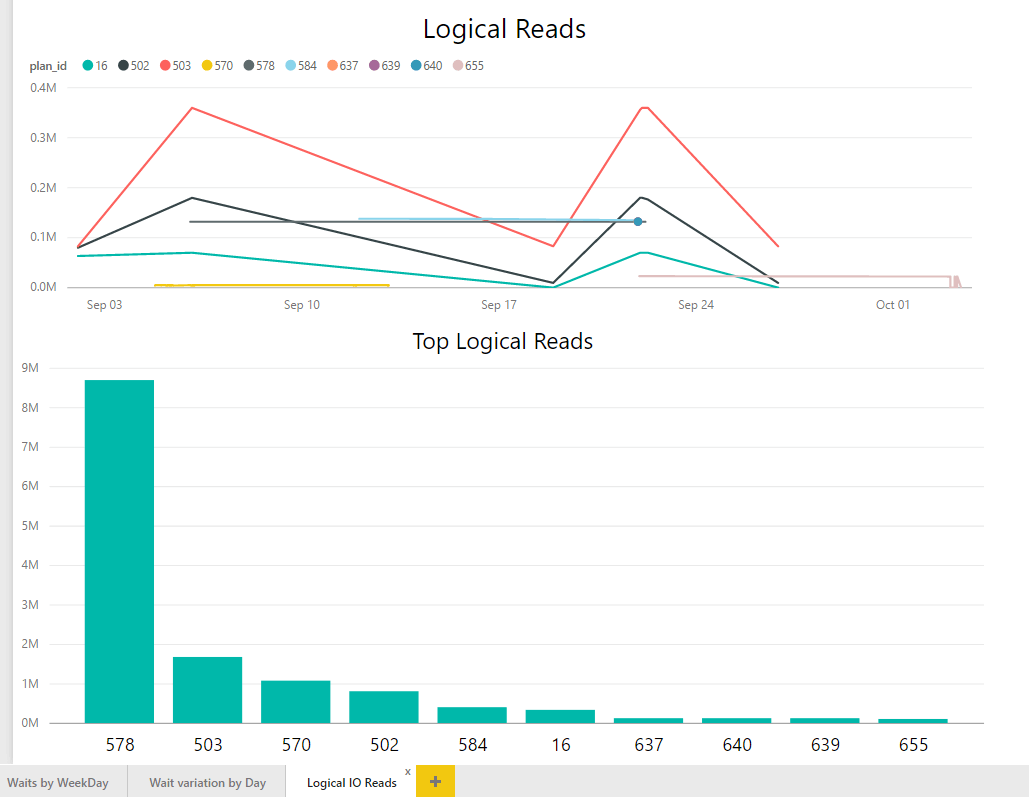
We can create several different reports with this model, I created only a few:
I configured the server and database name as parameters and saved the dashboard as a template (pbit) so everytime anyone double-click this file a new dashboard will be created and the values for the parameters will be requested.
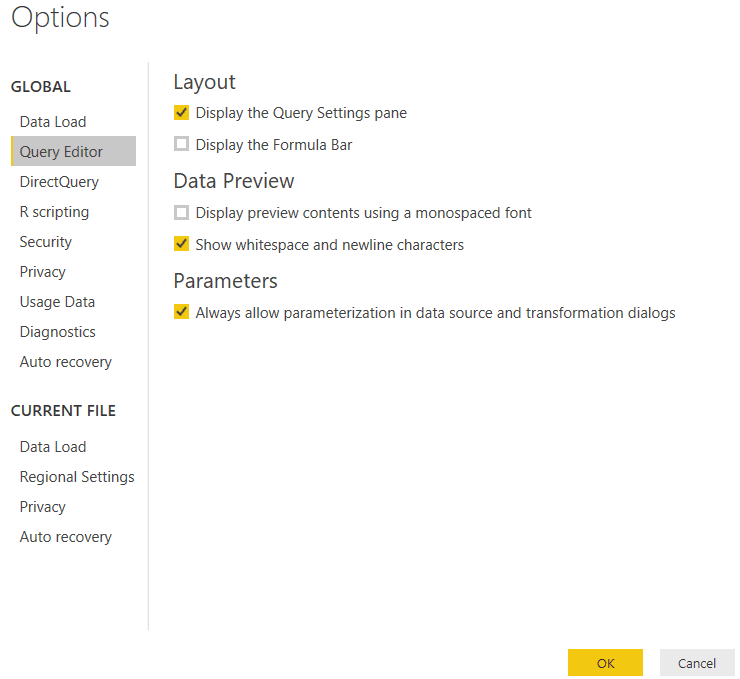
It’s interesting to notice that the Power BI interface doesn’t allow you to configure the server and database name as parameters. You need to enable this feature using the menu ‘File’-> ‘Options and Settings’->‘Options’->‘Query Editor’ and check the option ‘Always allow parameterization in data source and transformation dialogs’.
I published this template in a github project, you can download it here. If you create new interesting reports over these tables, your contribution to the dashboard will be very welcome.
For last, but not least, you can also publish this dashboard to the web, however, you will need to install the personal data gateway and configure the connections on power bi website.
This document contains proprietary information and is protected by copyright law.
Copyright © 2026 Red Gate Software Limited. All rights reserved


Load comments