
The .NET division at Red Gate have been working on a new way of profiling ASP.NET applications.
Traditional profiling tools live on the developer’s workstation and run in short bursts while the developer wrestles with a particular performance problem. If you’re a web developer, you’ll start and stop WebDev or IIS Express, or maybe a local installation of IIS, as part of an edit->compile->deploy->profile cycle. These profilers give you a source code view of where time is being spent, generally with method-level timings. But collecting the data in bursts this way can be cumbersome, and continuous monitoring tools, of the kind sysadmins currently use, seldom give you much detail about which part of the code is performing badly.
Another problem when profiling ASP.NET is that when something runs slowly the developer has to recreate the issue locally; attaching to a process on a running production server may be impossible, and restarting it to hook in a profiler is seldom permitted (or wise). Even getting access to a test machine can sometimes be problematic. Worse, these issues are rarely reproducible in a simple way – the website slows to a crawl, the administrator restarts IIS, everything is fine…and many of the clues required to fix the issue have been destroyed.
We wanted to make a tool to solve these problems: an “always-on” method-level profiler that runs as part of IIS and automatically records call-stack data for any application pools, giving you quick and easy access to the results. With continuous profiling, you can collect information at (and before) the point of failure, an approach much likelier to lead to a successful fix. Continuous profiling on your development machine gets less cumbersome, as edit->compile->deploy->profile becomes simply edit->compile->deploy. And you get real performance data throughout.
How does it work and what will it do to my system?
At first I was slightly daunted by the prospect of testing something that would live inside IIS – it felt like being asked to test the software for a pacemaker – but in fact the continuous profiler is a lot less invasive than standard profilers. It’s pretty much a passive listener, there’s no clever rewriting of IL or function detours, or anything that actually modifies the website under test. That’s not to say it’s perfect yet – it’s running in the IIS process, it’s unmanaged code (as profilers have to be, to sit outside the CLR), and it’s very, very new. On the other hand, our internal web team have been running it for several weeks on their test servers and it’s easy to disable from the IIS control panel.
Continuous profiling works by installing an IIS module that loads before the CLR. .NET is then configured to load the profiler DLL (or ‘core’) into w3wp.exe before the profiled website begins to execute. Our DLL can then record results for our web UI to read and display.
Will it make everything slow?
ANTS Performance Profiler will automatically hide insignificant methods (defined in terms of the number of instructions and amount of branching they contain, and the contribution they make to the total time), and we’re continuing to tune performance as we develop the tool. We’re currently exploring ways to reduce this even more, like functionality that lets you exclude high-overhead methods from profiling, for example. Meanwhile, you can expect your website to be perfectly usable while it’s being profiled, although overhead can vary depending on the nature of the site. Unsurprisingly, something held together with JavaScript will take less of a hit than something more traditionally server-side.
What can I expect to see?
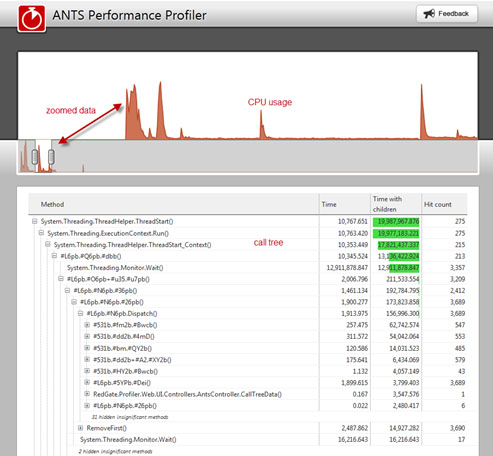
The interface is designed to help you find and explore performance bottlenecks quickly. At the top there’s a zoomable timeline with a graph of CPU usage and underneath there’s another timeline showing all the available data. When a region of time is selected, the main body of the webpage will display an expandable call-tree showing the time spent in each method, the cumulative time spent with all children of that method, and the hit count. If you’ve used Red Gate’s ANTS Performance Profiler before, the layout will be very familiar. Not all the planned features are complete yet – you can pick up our nightly builds to get new functionality as we release it!
Where do I get it?
The Early Access Program is now open. To participate, just download a build from http://help.red-gate.com/help/ANTSPerformanceProfiler/download_eap.html, and let us know what you think. We look forward to hearing your comments.
This document contains proprietary information and is protected by copyright law.
Copyright © 2026 Red Gate Software Limited. All rights reserved
Load comments