Inheriting a server, whether as an inexperienced user or an experienced DBA, has many challenges. It’s very helpful to evaluate the servers, document issues, and record the current configuration. It can also be beneficial to evaluate the current state of servers you have owned since they were built or even in preparation for a formal audit. The discovery and documentation phase of an audit will set you up for later detailed audits, or it may serve as the complete scope of the audit.
This is the first part of a series on evaluating and auditing SQL Server and Azure SQL Database. Auditing SQL is a very broad topic, so I have broken it down into several sections. This section will cover the major categories that should happen in a basic SQL Server discovery audit. An initial examination of your environment is primarily documentation and looking for critical issues. This includes basic server and SQL engine configuration, physical configuration items such as disk and memory, critical items such as backup state, database configuration, basic code smells, application integration, and high-level security configuration.
There are some items that I would categorize as critical and need to be known immediately. Other items are helpful in future planning and management, but all of them are useful as an administrator, new server owner, or even as an existing application owner. This list is also useful for evaluating servers you are asked to help troubleshoot on an ad-hoc basis.
The best way to have a successful audit is detailed planning. This is planning on your part and investigation on the scope of the audit. You need the cooperation of the server owners and the business owners for the databases. This may seem obvious, but I have been asked to audit servers in contentious circumstances. The server team or DBA team may not have confidence in the database application owners, or a team may be getting replaced and an unbiased status of the server is needed. These situations need to be carefully navigated. Keep in mind that you are there to assist and make the environment better, whether that is improved security, better performance, or evaluating coding standards. I have found a factual, non-confrontational, but honest approach works best in these scenarios, but you’ll have to handle these political situations with some sensitivity.
This series is written from the perspective of producing actionable results. Some items will be pure documentation, but this is still from the perspective of assisting with current or future requests. The initial audit will be your guide for later, more detailed audit sessions. This will depend on the specific goals of your later audits. There is overlap between the sessions. The initial audit is surface level compared to the later, detailed audits. This is the roadmap for subsequent tasks.
Scope of the audit
It’s difficult to separate the various sections of the audit completely. Each section impacts the others. Bad programming practices will impact server performance. A misconfigured or under-provisioned drive will impact applications. Security will be impacted by programming decisions and general network setup. Each can be audited individually, but remember the overlap.
Many audit items can be automated and a checklist can be used to make your audits consistent and repeatable. The initial goal is to give you an understanding of your general server environment, relevant parties, and understand current maintenance practices.
Stated objective
I go into an audit with my own agenda and list of items that need to be confirmed. It’s also important to get the client or server owners perspective on priorities. Some items may already be adequately covered and there may be additional items you hadn’t thought to check. If they are trying to save costs, you will pay special attention to performance levels and hardware utilization. If they are concerned about security, you will dig deeper on security configuration, user accounts, roles, password expirations, certificates and other security related items. If a cloud migration is the goal, you will want to look for items that aren’t compatible with the type of migration they are planning, or you can report on the type of cloud destination that is compatible. Cross database queries on an on-prem server won’t be a blocker if they are staying on-prem, but they will complicate a server to Azure Database migration.
If you are now responsible for the server, you will want to understand all aspects of the server and the associated environment. That will mean more detailed audits later, but as mentioned, the initial audit is a good starting point.
Objectives
- General environment documentation
- General server and database state
- Environments
- Applications
- Critical items
- Maintenance tasks
- Performance
- Error logs
- Security
- Code smells
Security needed for the audit
The scope of the audit will dictate the security needed to evaluate the server or databases. If you are performing a complete audit, looking at security, evaluating performance, digging into the query cache, and additional detailed items, you will need elevated security. This is especially true if you are not a regular user of the server. Sometimes there are limitations on what will be granted, so take that into consideration when preparing for your audit. Having prepared scripts for DBAs to run considerably reduces frustration in these scenarios. You will likely need to involve other teams in the audit, so get those contacts and introductions too.
General environment
General information about the server and environment is needed as a starting point. This will include the server owner, the business owner, and technical owner. Capture and record each of these. If there are questions or issues with the server during the audit, or in the future, they will need to be notified or consulted. From a practical standpoint, they will likely need to sign-off on the advanced security you need to examine everything.
If this is a SQL Server installation, there might be multiple databases owned by multiple stakeholders. Each of these should be recorded as well. The reasoning for this is the same as the server documentation. These stakeholders may have input on your audit and should be interested in the results of the audit. It’s also possible that they will be assigned action items based on the results of the audit.
You may not be able to capture this, but applications and other database customers should be recorded if they are known. This could differ from the database owners, especially if it is a warehouse or reporting database. The intended use of warehouse databases or a reporting server is shared access, so it is possible there will be quite a few users. This is the list of impacted users when the server or database is modified or if there are issues.
General server and database state
Much of the current state evaluation will require interviewing other team members. Some of the items can be automated or scripted and some are controlled outside of the SQL Server environment. For the discovery phase, the following items may be documentation only and not require scripts or Azure portal access. Detailed examination can happen in a later audit.
At a server level, the engine version and licensing model are useful to know. The SQL engine version can be queried, but the licensing model can’t. You’ll need to talk with the purchasing / procurement / FinOps department, or the DBA team to get licensing information. The licensing model impacts cost. The version information has a direct performance impact due to options available in each version or pricing tier (in Azure). It can also impact upgrade paths, including cloud options.
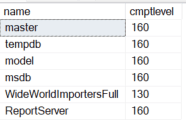
You won’t dig deep into database configurations at this point, but the databases on a server, the compatibility level, and possibly the size of each database should be noted. The compatibility level of a database isn’t automatically updated to the latest when the server is upgraded. This will limit or enable features, including performance related items, and is a primary reason for verifying the level. The database names and compatibility level is a simple query.
|
1 2 3 4 |
SELECT name ,cmptlevel FROM sys.sysdatabases DB |
Database space can be gathered by looking at standard reports (in SSMS) for each database or via system views. The following is a server wide view and will not work with Azure databases. Also note that this query groups all database files, including log files. You may want to look at the files individually later.
|
1 2 3 4 5 6 7 8 9 |
SELECT @@SERVERNAME ServerName ,DB_NAME(database_id) DatabaseName ,SUM((size*8)/1024) SizeMB ,CONVERT(date,GETDATE()) ReportDate FROM sys.master_files MF GROUP BY DB_NAME(database_id) ORDER BY DB_NAME(database_id) GO |

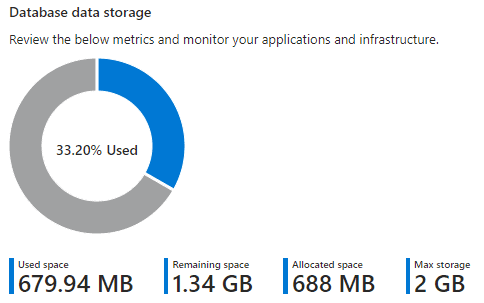
The Azure portal can be used or sys.database_files, to look at Azure databases individually. Note that this also includes log files with the total and it will not match the “Used space” listed in the portal. If you look at the individual files, you would see that the data size is 688, which matches the Azure portal “Allocated space”.
|
1 2 3 4 5 6 |
SELECT @@SERVERNAME ServerName ,DB_NAME() DatabaseName ,SUM((size*8)/1024) SizeMB ,CONVERT(date,GETDATE()) ReportDate FROM sys.database_files |
![]()
The database state and deployment model is interesting from a standards perspective. If objects are consistently created and named, it follows that development standards are more likely to be carefully followed. You can usually understand if there is a rigorous deployment process based on the consistency of databases between environments. This will give you a general idea of the deployment process, but you’ll need to look at the actual deployments in the CI/CD or automated deployment process to be sure. Rely on the application teams for your initial assessment, especially if you are evaluating a number of projects.
Source control is related to automated deployments. The best-case scenario is a deployment based on checked-in code. This requires a database project in source control and all changes to database structure going through this process. It also makes code reviews and evaluating best practices easier in the future.
Environments
Closely tied to the server state and database state are the environments. It is highly advisable to have multiple environments for each application, such as development and production. Two systems are a minimum, but for critical systems you might have separate development, test, staging, automation, and production environments. With Azure, it is easy to automate the building of these systems and teardown when they are inactive, so the cost is easier to control. With serverless implementations it is also possible to have CPUs scale up and down dynamically, allowing the necessary performance while keeping costs lower.
Applications
Applications accessing the server and databases may be clear, especially for a dedicated server and transactional databases. The primary application will likely have a name that corresponds to the database or server name. This should be confirmed and documented. In larger organizations, with clearly defined division of responsibility, there may be several owners. All responsible parties should be recorded. This is useful for upgrade planning, sign-offs, and maintenance planning.
A system trace or extended events can be used to capture the applications using the database. Even if there is a known list of applications, it’s a good idea to take a detailed look using these methods during later audits.
Critical Items
There are several items I would categorize as critical and should be examined in the initial audit. These are key items for the discovery phase. These are things that need to be looked as you are planning or immediately after you start. Due to their critical nature, they might need immediate action or they will be part of the action plan you prepare.
Maintenance Tasks
Regular database maintenance is easy to implement and some of the most important tasks are automatic in Azure. Some surprisingly simple tasks are not automated in Azure, so they still need to be validated. In a discovery audit, these tasks need to be confirmed and this will likely be the most technical part of the first audit.
Backups
The current backup configuration and state of backups is critical. This is one of the items that should be checked first and addressed even before continuing your audit if found lacking.
Backups happen automatically with Azure SQL Database and with Azure managed instances. If you install SQL yourself, backups are manually configured. This is true for VMs and physical hardware. It is also true of VMs configured by your team in Azure (not a managed instance). Key things to check include the backup type, schedule, storage location, and integrity of backups. You may not need to see a test restore for the initial audit, but you will want to be sure the organization periodically confirms the backups are valid and can be restored successfully.
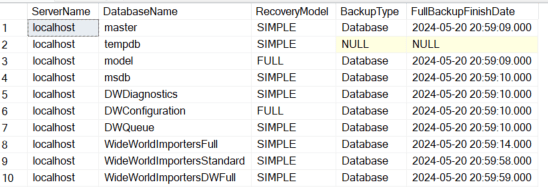
With full server installations, there are many methods and third-party tools that can perform backups, so verify the method used. The following script can be used to see backup history for backups recorded in msdb. Most third-party tools will use the SQL Writer Service, which will record the backup, but custom methods may bypass logging here.
|
1 2 3 4 5 6 7 8 9 10 11 12 13 14 15 16 17 18 19 20 21 22 23 24 25 26 |
SELECT BS.Database_name ,BS.type ,CASE BS.type WHEN 'D' THEN 'Database' WHEN 'I' THEN 'Differential database' WHEN 'L' THEN 'Log' WHEN 'F' THEN 'File or filegroup' WHEN 'G' THEN 'Differential file' WHEN 'P' THEN 'Partial' WHEN 'Q' THEN 'Differential partial' END BackupType ,BS.user_name ,BS.first_lsn ,BS.last_lsn ,BS.backup_start_date ,BS.backup_finish_date ,BS.server_name ,BS.compressed_backup_size ,BMF.physical_device_name ,ROW_NUMBER() OVER(PARTITION BY BS.database_name, BS.type ORDER BY BS.database_name, BS.type, BS.backup_start_date DESC) SELECT_CRITERIA FROM msdb.dbo.backupset BS INNER JOIN msdb.dbo.backupmediaset BMS ON BS.media_set_id = BMS.media_set_id INNER JOIN msdb.dbo.backupmediafamily BMF ON BS.media_set_id = BMF.media_set_id |
You can compare the backup history against the complete list of databases to ensure they are all getting backed up properly. Remember that tempdb won’t be backed up (and backups aren’t allowed) since it is recreated at every restart of the SQL service, so don’t look for it in your list. The following script shows the most recent backup for each database in a server environment.
|
1 2 3 4 5 6 7 8 9 10 11 12 13 14 15 16 17 18 19 20 21 22 23 24 25 26 27 28 29 30 31 32 33 34 35 36 37 38 39 40 |
; WITH BACKUP_CTE AS ( SELECT BS.Database_name ,BS.type ,CASE BS.type WHEN 'D' THEN 'Database' WHEN 'I' THEN 'Differential database' WHEN 'L' THEN 'Log' WHEN 'F' THEN 'File or filegroup' WHEN 'G' THEN 'Differential file' WHEN 'P' THEN 'Partial' WHEN 'Q' THEN 'Differential partial' END BackupType ,BS.user_name ,BS.first_lsn ,BS.last_lsn ,BS.backup_start_date ,BS.backup_finish_date ,BS.server_name ,BS.compressed_backup_size ,BMF.physical_device_name ,ROW_NUMBER() OVER(PARTITION BY BS.database_name, BS.type ORDER BY BS.database_name, BS.type, BS.backup_start_date DESC) SELECT_CRITERIA FROM msdb.dbo.backupset BS INNER JOIN msdb.dbo.backupmediaset BMS ON BS.media_set_id = BMS.media_set_id INNER JOIN msdb.dbo.backupmediafamily BMF ON BS.media_set_id = BMF.media_set_id ) SELECT @@SERVERNAME ServerName ,SD.name DatabaseName ,SD.recovery_model_desc RecoveryModel ,FL.BackupType ,FL.backup_finish_date FullBackupFinishDate FROM sys.databases SD LEFT JOIN BACKUP_CTE FL ON SD.name = FL.database_name AND FL.type = 'D' AND FL.SELECT_CRITERIA = 1 |
Azure Backups
Azure database backups are easier in many ways. They are automatically configured but you need to check the method and retention period to ensure it meets your enterprise standards and needs of the project. You can also look at the oldest available backup for each database in the Azure portal.
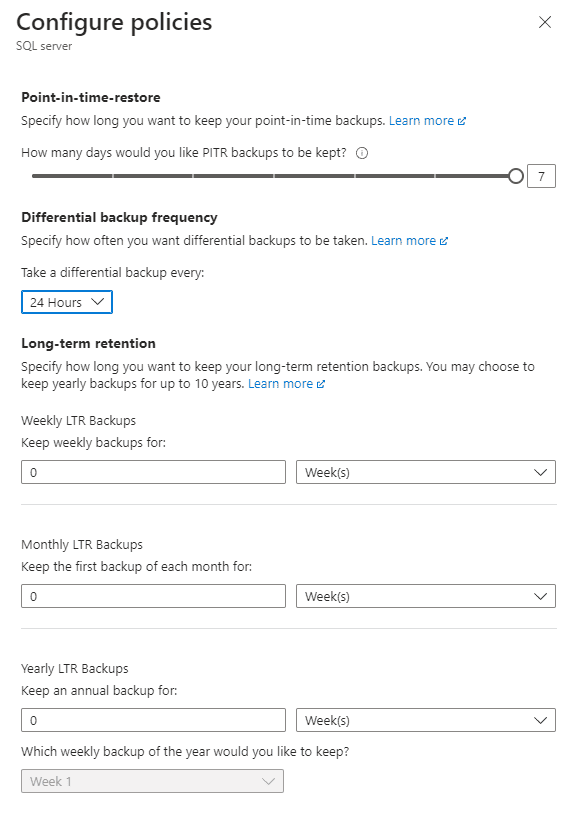
These are managed at the server level. In the “Data management” section of the server, you can examine available backups for each database, retention policies and configure those policies.

Additional settings are available at higher priced tiers. The following shows a basic, DTU based database in Azure. You can choose 12 hours or 24 hours for differential backups. Other tiers include transactional backups. Confirm data is backed up and available as specified by the business policy.

Index maintenance
Indexes that are fragmented or with outdated statistics can lead to poor, or inconsistent, query performance. There are many potential reasons for poorly performing queries, but maintaining indexes and statistics is simple preventative maintenance.
Checking index usage and fragmentation can be resource and time intensive. You will want to be cautious checking physical stats for indexes. Perform your check during non-critical hours. You may also want to choose a few targeted tables rather than checking the entire database.
The following shows usage of indexes and heaps, along with fragmentation.
|
1 2 3 4 5 6 7 8 9 10 11 12 13 14 15 16 17 18 19 20 21 22 23 24 25 26 27 28 29 30 31 32 33 34 |
SELECT SS.name SchemaName ,SO.name ObjectName ,SI.name IndexName ,DDIU.index_id ,DDIU.user_seeks ,DDIU.user_scans ,DDIU.user_lookups ,DDIU.user_seeks + DDIU.user_scans + DDIU.user_lookups user_reads ,DDIU.user_updates user_writes ,DDIU.last_user_scan ,DDIU.last_user_seek ,DDIU.last_user_lookup ,DDIU.last_user_update ,DDPS.avg_fragmentation_in_percent ,DDPS.page_count ,DDPS.avg_fragmentation_in_percent * DDPS.page_count FragmentationImpact FROM sys.dm_db_index_usage_stats DDIU INNER JOIN sys.objects SO ON DDIU.object_id = SO.object_id INNER JOIN sys.schemas SS ON SO.schema_id = SS.schema_id LEFT JOIN sys.indexes SI ON DDIU.object_id = SI.object_id AND DDIU.index_id = SI.index_id LEFT JOIN sys.dm_db_index_physical_stats(DB_ID(), NULL, NULL, NULL, NULL) DDPS ON SI.object_id = DDPS.object_id AND SI.index_id = DDPS.index_id WHERE DDIU.database_id > 4 -- filter out system tables AND OBJECTPROPERTY(DDIU.OBJECT_ID, 'IsUserTable') = 1 ORDER BY SS.name ,SO.name ,SI.name |
The usual way to maintain indexes on a full server installation is with maintenance plans. Getting the history of the maintenance plan is the easiest way to confirm this is being done on a regular schedule.
Maintenance plans aren’t available with Azure SQL Database. Check with the team responsible for the database on their method for maintaining indexes.
Statistic Maintenance
Statistics need to be maintained for the query engine to be able to use indexes correctly and provide the best query plan. This can be the difference between a well performing query or a query that will eventually time out. The following will show the date when the statistics were last updated for all user tables in the database. This will give you an indication of the health of the statistics for each database.
|
1 2 3 4 5 6 7 8 9 10 11 12 13 14 15 16 17 18 19 20 21 22 23 24 |
SELECT @@SERVERNAME ServerName ,DB_NAME() DatabaseName ,SS.name SchemaName ,SO.name ObjectName ,SI.name IndexName ,STATS_DATE(SO.object_id, SI.index_id) AS stats_date ,GETDATE() CurrentDate FROM sys.indexes AS SI INNER JOIN sys.objects SO ON SI.object_id = SO.object_id INNER JOIN sys.schemas SS ON SO.schema_id = SS.schema_id INNER JOIN sys.partitions P ON P.object_id = SI.object_id AND P.index_id = SI.index_id WHERE OBJECTPROPERTYEX(SI.object_id, 'IsSystemTable') = 0 AND SI.index_id > 0 AND P.rows > 0 ORDER BY SS.name ,SO.name ,SI.name GO |
This is another task that can be done with maintenance plans. Look at the maintenance plan history or check with the database team for their strategy.
DBCC for database integrity
DBCC is the Database Console Command. It works with any version of SQL and has various command subsets for maintenance and database validation. It is common practice to check database and table consistency checks on a regular basis. If issues are found, data may need to be restored from a backup, so it is better to find issues quickly.
|
1 |
DBCC CHECKDB |
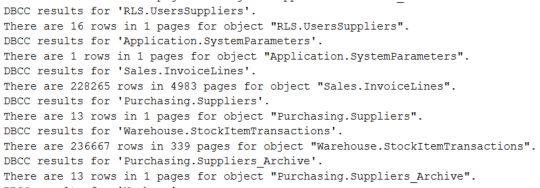
Simply running DBCC isn’t enough, the results need to be evaluated. If run with the default options, the results show rows and pages for each table. If there is a problem such as a broken page, this will be shown and needs to be managed. You won’t want to run the DBCC statement during your audit, just confirm that it is happening and getting evaluated. This is another item that is available in maintenance plans. Maintenance plan history or Azure strategy needs to be documented.
Performance
High level performance metrics are easy to check and have the potential to impact all queries running on the server. Depending on your access and your experience, you may need to have the server team check these items for you. Even if another team gathers the metrics, you need to know what should be collected and perform the basic analysis. The goal of examining performance metrics is to find bottlenecks.
CPU
CPU utilization can have a big impact on overall server performance. If CPU levels are consistently spiking or is elevated for a significant time, it will lead to performance issues.
In an Azure database, the CPU percentage can be found in the Monitoring/Metrics section of the portal. In a full SQL Server, the OS metrics can be used to find CPU utilization.

I/O
If you have an on-prem server, you will need to work with the server and SAN administrators to look at I/O performance. The specific metrics will vary depending on the I/O infrastructure and type of persistent storage used. If it is traditional disks, the type of RAID configuration, number of disks, type of disks, speed, etc. is important. With SSD or memory drives, this will usually be less of an issue. The administrators can confirm the utilization levels for the discovery phase. In Azure, you can look at the Data IO Percentage for your database as a starting point.
Memory Utilization
SQL Server runs best with plenty of RAM. The specific amount that is “plenty” will depend on your application and usage patterns, but more is usually better. Having more RAM allows more data pages to be kept in memory and significantly improves performance. This is a more complicated topic and probably not something you will dig into with your initial audit. In later audits, it can be useful to examine pages in memory by table, queries consuming the most memory, and sessions consuming the most memory.
Setup
Key items with SQL Server configuration should also be validated. These items are available in full SQL Server installations, but not in Azure SQL database. You can either use the GUI, or use the procedure sp_configure to look at the memory options. Advanced options need to be enabled to look at the memory configuration via TSQL.
|
1 2 |
EXEC sp_configure 'show advanced options',1 RECONFIGURE |
Once that is done, you can validate the minimum and maximum memory allowed to be consumed by SQL. Note that this is different from the server memory actually installed or available in the VM.
|
1 2 |
EXEC sp_configure 'min server memory (MB)' EXEC sp_configure 'max server memory (MB)' |

On a server, I would expect the min value and max value to be the same. Also note that the maximum value can be set above the actual installed memory for the server. This can choke the memory for the OS and degrade overall performance significantly if the OS needs to start paging. There should be some memory reserved for the OS, at least 4-8 GB (or more). This will depend on your application, but for the audit, note the value and be sure the max is reasonable.
One other high-impact, easy to check item is xp_cmdshell. This is generally considered a potential security gap and you will want to be aware if it is enabled so you can explore the reasoning. This is also limited to a full SQL Server installation.
|
1 |
EXEC sp_configure 'xp_cmdshell' |

If you see it enabled, as it is above, note this as a critical item and talk to the administrators about the problem they are solving with it.
Deadlocks
Deadlocks and excessive blocking are also relatively easy to examine and are a good indicator of server performance and health. For the first audit, you aren’t looking for deadlock details, just determining if there are excessive, or any, deadlocks. If you find deadlocks during the discovery phase, they can be investigated later. Deadlocks can be found with SQL Trace, logs, and Azure metrics as shown below.

Excessive blocking
Blocking of processes is a normal, expected activity in SQL Server. It is the basis for transactional consistency. Blocking becomes a problem when it is excessive. I would consider it excessive when it reduces performance or is noticed by the users. I will show more reliable ways to look at blocking in future sections, but you can see current blocks by using the following. This works in all environment types.
|
1 2 |
SELECT * FROM sys.sysprocesses |
I forced a block in this example by creating an update statement in a transaction without a COMMIT statement. If you see many rows where the “blocked” column isn’t 0, you see it frequently when checking, or the “waittime” is long on the blocks, you will want note it as a potential issue on the server.

Engine version
The database engine is the heart of SQL Server and was mentioned in the general server section. The version used (i.e., SQL Server 2022) has an impact on security, functionality, performance, available support and service packs, the upgrade path, and available features. If you are moving to a cloud environment, it can also limit your options if you are on an older engine version. It needs to be documented and evaluated. This is another critical item if the engine is no longer supported or will be dropped from support soon.
|
1 2 3 4 5 6 7 8 |
SELECT @@VERSION Microsoft SQL Azure (RTM) - 12.0.2000.8 Feb 2 2024 04:20:23 Copyright (C) 2022 Microsoft Corporation Microsoft SQL Server 2022 (RTM-GDR) (KB5035432) - 16.0.1115.1 (X64) Mar 15 2024 01:13:46 Copyright (C) 2022 Microsoft Corporation Developer Edition (64-bit) on Windows 10 Pro 10.0 <X64> (Build 22631: ) (Hypervisor) |
Error Logs
The error logs for the server are a frequently overlooked source of information. Be sure to look at these for potential, or actual, issues. It can show deadlocks, memory issues, performance issues and many other items.
If you have direct access to the files on the server, you can open the log files directly. This is especially useful if the server won’t start correctly, but is less useful in an audit scenario. If you aren’t familiar with the log files generated by SQL, they are created sequentially and rotate as the service starts. The following command can be used to look at any of the log files in rotation by specifying the log number, starting with zero (0).
|
1 |
EXEC master.sys.xp_readerrorlog |

Warnings are also included in the log files, so you will likely want to filter results and just focus on the errors.
Azure SQL Database
The system stored procedure sys.xp_readerrorlog doesn’t work with Azure SQL Databases. You can get a connection summary with the DMV, sys.database_connection_stats. Note that you must be in the master database on the logical server to SELECT from these DMVs.
|
1 2 |
SELECT * FROM sys.database_connection_stats |

Detailed information about failed and successful logins, along with the description for the failed logins is available via the DMV, sys.event_log.
|
1 2 |
SELECT * FROM sys.event_log |

More detailed information can be gathered via extended events. Extended events work with both full SQL installations and with Azure databases. They are generally beyond the scope of the discovery phase of an audit, but are very useful for more detailed server analysis.
Security
You won’t perform a deep-dive on security in the initial audit but are a few items to validate. The main items are your system administrators, users with other server roles, and the list of database owners. There are many other items that are very interesting from a security perspective, but keeping the focus on a preliminary audit narrows that list considerably. If you don’t flag items in this first list, it doesn’t mean the server is secure, it is the first piece of your audit. But it can be an indicator of the attitude toward security within the responsible team or organization.
System administrator list and other server roles
|
1 2 3 4 5 6 7 8 9 10 |
SELECT USR.name LoginName ,USR.type_desc LoginType ,ROL.name RoleName ,ROL.type_desc RoleType FROM sys.server_principals USR INNER JOIN sys.server_role_members SRM ON USR.principal_id = SRM.member_principal_id INNER JOIN sys.server_principals ROL ON SRM.role_principal_id = ROL.principal_id |

This shows a base installation of SQL Server 2022 Developer Edition and the assigned server roles. In a production environment you will see your administrator groups and hopefully not much else.
Database owner list and other database roles
|
1 2 3 4 5 6 7 8 9 10 11 12 |
SELECT @@SERVERNAME ServerName ,DB_NAME() DatabaseName ,USR.name UserName ,USR.type_desc UserTypeDescription ,ROL.name RoleName ,ROL.type_desc RoleTypeDescription FROM sys.database_principals USR INNER JOIN sys.database_role_members DRM ON USR.principal_id = DRM.member_principal_id INNER JOIN sys.database_principals ROL ON DRM.role_principal_id = ROL.principal_id |
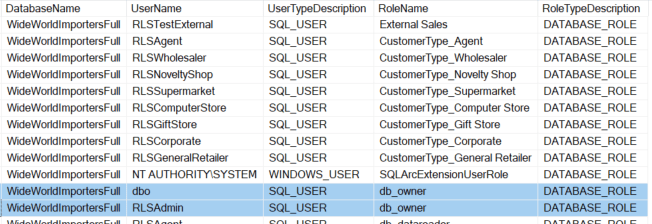
With this script you are primarily looking for the db_owner. In a production environment you will also want to pay attention the other default roles such as db_datawriter, db_ddladmin, and db_securityadmin. Depending on the data used in each environment and enterprise policies, these may also be relevant in lower environments.
Other elevated privileges
Privileges can also be assigned directly to users. This is more of an advanced audit, but you can quickly look for elevated privileges assigned at a user level with the following script.
|
1 2 3 4 5 6 7 8 9 10 11 12 13 14 15 |
SELECT DP.class_desc ClassDescription ,SUGR.name GranteeName ,SUGO.name GrantorName ,DP.type PermissionType ,DP.permission_name PermissionName ,DP.state PermissionState ,DP.state_desc PermissionStateDescription FROM sys.database_permissions DP INNER JOIN sys.sysusers SUGR ON DP.grantee_principal_id = SUGR.uid INNER JOIN sys.sysusers SUGO ON DP.grantor_principal_id = SUGO.uid WHERE SUGR.hasdbaccess = 1 AND DP.permission_name <> 'CONNECT' |
The detailed security audit will explore all of the objects and the specific security assigned. This initial audit shows any user directly assigned security. If you see something, such as CONTROL, or ALTER, you will want to look at those users and their security assignments for details.

Azure Security
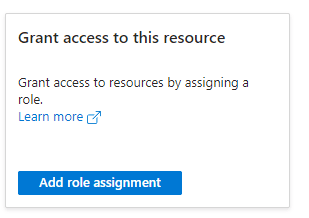
Azure databases can be queried in the same way as an on-prem server, but there are different roles. The databases also need to be queried individually. Server level roles and access control can be viewed in the Azure portal. The following shows the roles available via this panel.
![]()
Code smells
Code smells have been documented extensively and they can be considered subjective to a degree. They aren’t critical, but I still like to look at the codebase or even just the databases and database objects for the discovery audit. At this phase I look for things that make maintenance more difficult. This includes inconsistent naming of objects or poorly implemented standards. If the database objects look like they were created by different teams with different naming standards, it can be an indication that other standards aren’t being followed. This can include using names reserved by the system, spaces in names or any other object name that require brackets to be used in TSQL.
Another quick thing to check is inconsistency between environments. This can be due to a lack of automated deployments or too many manual changes. It can also mean that test / development objects created by developers aren’t getting cleaned up. This may not impact performance, but it makes the database more difficult to maintain.
Things will never be completely consistent, but that is the goal. This also ties into your data governance strategy. Naming conventions, deployment patterns, development standards are all items that benefit from a centralized approach.
Summarizing recommendations
A critical part of auditing a server is concisely summarizing your findings. For the initial audit, this may be the most important task. If you find critical items, they need to be communicated quickly. Even if the server is running well and there are no pressing issues, summarizing the current state will help focus the next section of your audit.
You first need to prioritize your findings. As mentioned, critical items should be communicated immediately so they can be prioritized and fixed. I like to put the critical items in the executive summary, in a detailed section specifically for critical items, and again in the document summary. This leaves no room for doubt and emphasizes the importance of your findings.
Less crucial items can then be put into the documentation in a structured fashion. Find or create a template that works within your enterprise. You may want to link existing documentation to reduce redundancy.
It is ideal if you can get the time to discuss your audit findings with the server stakeholders. Sometimes they just want the summary document, so be sure everything is very clear. If you can have a discussion about the audit, it’s much easier to relay the nuances of the audit and plan next steps. This is when you will decide what to focus on for detailed audits. As mentioned above, you might want to expand on hardware and server configuration, performance, SQL code, security, maintenance items, related SQL services, and cloud migration readiness. These audit details will be explored in future sections.
References
https://learn.microsoft.com/en-us/sql/dma/dma-overview?view=sql-server-ver16
https://learn.microsoft.com/en-us/azure/azure-sql/database/elastic-query-overview?view=azuresql
https://learn.microsoft.com/en-us/azure/azure-sql/database/elastic-jobs-overview?view=azuresql
119 SQL Code Smells – Simple Talk (red-gate.com)


Load comments