
ANTS Performance Profiler 8 has just shipped! We’ve been working on it for eight months, and there’s a huge amount of new functionality to make it easier than ever for you to nail performance problems and write awesome-fast software. If you’d prefer to go straight ahead and try it for yourself, you can do just that over on the Red Gate website. Otherwise, let’s take a look at what’s been added.
Firstly, you can now look at how your application communicates with other web servers, with web request profiling. Any outbound http requests your application makes are captured, along with the url, verb, status code, and complete request and response header information.
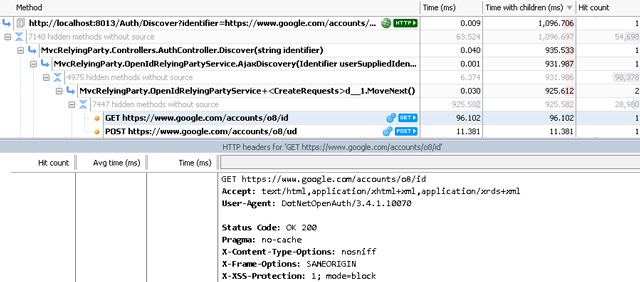
Perhaps more cool is that the information about those requests is shown to you in the application’s call tree alongside your .NET code and information about any database calls, so you can see exactly what led to requests being made.
We’re really excited about async / await in C#5, because of just how much simpler it is to write asynchronous code. The catch is that if you ever want to look at how that code executes, like if you were, say, profiling your application’s performance, you suddenly get exposed to the mysterious under-the-hood workings of async. How the code is actually executed by the CLR bears little resemblance to the code you wrote, so it’s difficult to understand where any performance problems might lie.
ANTS now has a unique async profiling mode, which lets you look at your async code’s performance as you wrote it. The continuation of an async method (after an await keyword) is shown to you as being part of the parent async method, whereas previously and in other tools it’s just shown as happening on the threadpool with nothing to suggest how the activity is related to the async method. Any time spent doing work asynchronously can also be attributed to the parent async method that caused that work to happen, so you’re finally able to see see how actions like making asynchronous database calls are affecting the performance of your application, and get a deep understanding of why that activity is happening.
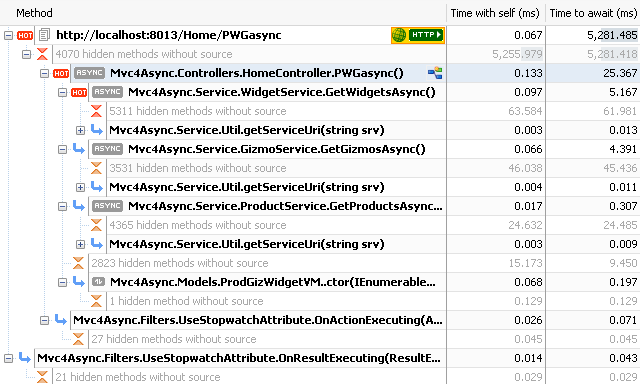
If you’re doing things like using async controllers in MVC4 / Web API, or are writing a Windows Store application with C#, we’re pretty sure this is going to make your life easier.
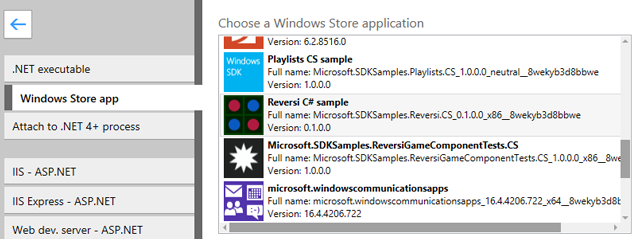
Speaking of Windows Store apps, support has been added for them too. You’ll be able to write faster apps which feel more slick – something which is particularly important for the lower-powered hardware on which they might be running. While we’re on new technology support, SharePoint 2013 applications can now be profiled as well.
If you’ve used a previous version of ANTS, you’re going to notice some major changes to the UI. The entire startup process has been rebuilt from scratch, making it easier and faster to begin profiling. The job of any startup process it to get out of the way as fast as possible, and that’s just what we’ve aimed for. In fact it’s really common to want to repeatedly run similar sessions, and that’s now possible in a single click using the new recent session history.
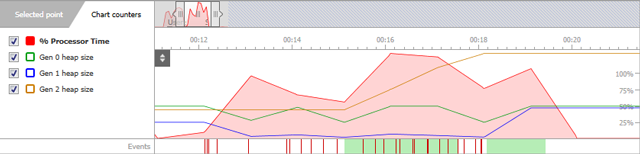
The timeline has also been completely redesigned. It’s now easier to look at different performance counters and to jump around between different time periods. You can also see exceptions on the timeline, then jump to the precise place in the call tree where they were thrown.
There are a load of other enhancements, like the ability to profile ASP.NET applications using any browser rather than Internet Explorer, and also more bug fixes than you could shake a stick at.
A final point: lots of these improvements have been directly driven by feedback from users telling us what they’d like to see. If you’ve got ideas for new features or enhancements, we’d love to hear from you. Just drop an email to dotnetteam@red-gate.com.
Try the new version out for yourself, and let us know what you think!
Ben
Load comments