
I’m excited to say that we’ve just released ANTS Memory Profiler 8!
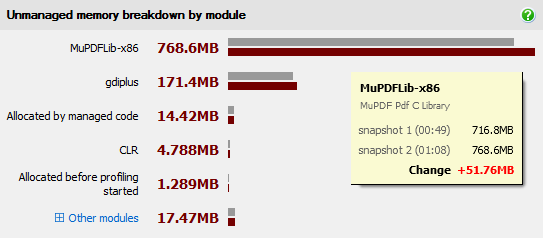
The big news is support for profiling .NET’s usage of unmanaged memory. There are two main parts to this. Firstly you can see a breakdown of unmanaged memory usage by module. This lets you see at a high level where unmanaged memory is being used – for example in the image below, it’s being used by a PDF generation library.
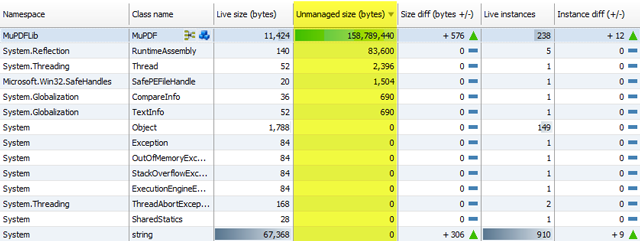
Separately, when looking at a list of .NET classes, you can see how much unmanaged memory those classes are responsible for holding on to. You can also see that information for individual instances of those classes.
Some clues you might need this:
- You’re using system objects or 3rd party components which deal with unmanaged memory under the hood (this includes things like the GDI+ functions used for working with bitmaps)
- Your application still relies on some legacy Delphi / C++ / etc code from left over from the days before your company moved over to using .NET
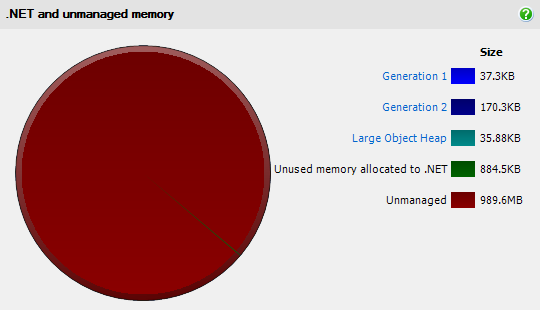
- You’ve used a previous version of ANTS Memory Profiler, and have ever seen a pie chart that looks something like this:
You’ll also notice that the startup process has been entirely redesigned, bringing it in line with ANTS Performance Profiler 8, which was released earlier in the year. This makes it faster to start profiling and to run repeat profiling sessions, lets you profile using any browser instead of Internet Explorer, and also provides a host of stability improvements, particularly when launching websites in IIS.
Download the new version (there’s a free trial), and as always I’d love to know what you think – just email dotnetteam@red-gate.com.
Cheers!
Ben
Load comments