


We already discovered how to investigate Kusto query history. Let’s discover how to analyse query performance considering the information on this history.
The query history returns 3 fields we can use to make a more detailed analysis of the queries: CachedStatistics, ScannedExtentsStatistics and ResultsetStatistics.
Disclaimer: There are low to no documentation about this content. In this way, the content below may not be 100% precise but will give you good guidance.
ScannedExtentsStatistics
This field provides information about the number of records scanned and returned in different formats.
In Kusto, considering the number of records we may deal with, we always need to ensure we filter the data to get only meaningful information. Are records older than 3 months meaningful? Older than 1 month?
Using the values in this field we can identify the amount of scanned data. If this amount is too high you may have a problem, such as a query without the correct filters.
These are the values we can use:
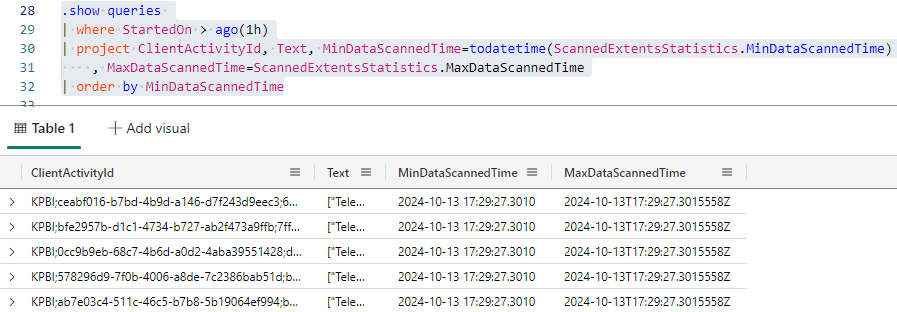
MinDataScannedTime, MaxDataScannedTime: These are date/time values telling the oldest record which was checked and the newest record that was checked. Especially in relation to the oldest, if too many records which are not important to the result were checked, there is a problem in the query.
We can query this information ordering by MinDataScannedTime in ascending order. The first queries in the result will be the ones scanning the oldest records in the table.
.show queries
| where StartedOn > ago(1h)
| project ClientActivityId, Text, MinDataScannedTime=todatetime(ScannedExtentsStatistics.MinDataScannedTime)
, MaxDataScannedTime=ScannedExtentsStatistics.MaxDataScannedTime
| order by MinDataScannedTime
The result of extracting the data from a JSON field is of type DYNAMIC. The ORDER BY statement doesn’t accept a field of this type. As a result, we need to convert the type.
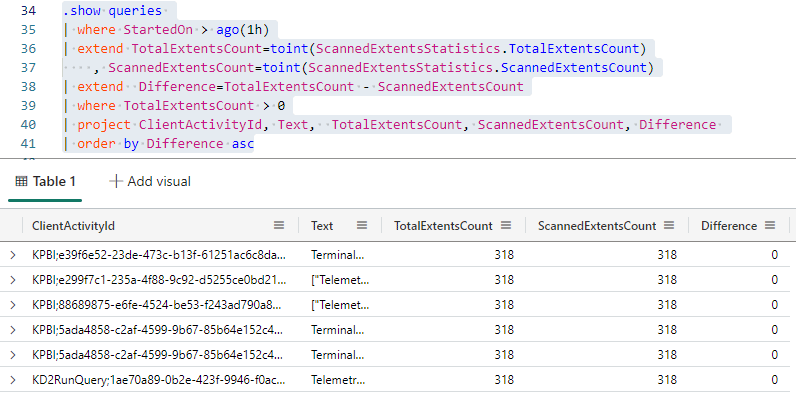
TotalExtentsCount, ScannedExtentsCount: We can make a comparison between the total of extents and the number of scanned extents. Lower the difference, worse the query. The lower the difference, the closer the query was to scan the entire table.
.show queries
| where StartedOn > ago(1h)
| extend TotalExtentsCount=toint(ScannedExtentsStatistics.TotalExtentsCount)
, ScannedExtentsCount=toint(ScannedExtentsStatistics.ScannedExtentsCount)
| extend Difference=TotalExtentsCount - ScannedExtentsCount
| project ClientActivityId, Text, TotalExtentsCount, ScannedExtentsCount, Difference
| order by Difference asc
Extents are data segments in Kusto tables. The database creates these segments automatically when managing the kusto data ingestion.
TotalRowsCount, ScannedRowsCount: We can compare the total rows of the table to the scanned rows for the query. Lower the difference, worse the query. The lower the difference, the closer the query was to scan the entire table.
.show queries
| where StartedOn > ago(1h)
| extend TotalExtentsCount=toint(ScannedExtentsStatistics.TotalExtentsCount)
, ScannedExtentsCount=toint(ScannedExtentsStatistics.ScannedExtentsCount)
| extend Difference=TotalExtentsCount - ScannedExtentsCount
| project ClientActivityId, Text, TotalExtentsCount, ScannedExtentsCount, Difference
| order by Difference asc
ResultsetStatistics
This field contains statistics about the resultset created by the query. The most interesting information is the row count.
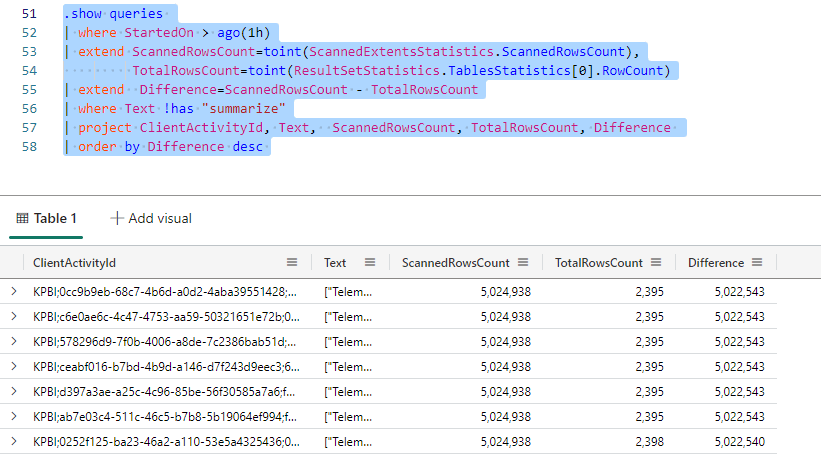
RowCount: There are some analysis possible to be done in relation to the row count. Are we returning too many rows? Do we really need to return this amount of rows? There is also the possibility to compare the total of rows returned with the total of rows scanned. However, this has low meaning, because it depends a lot of the query you are executing. Queries grouping and summarizing will have a big difference between rows returned and scanned. Only queries returning detail rows should not have such a big difference, but it still can vary a lot.
This is how we can make this comparison:
.show queries
| where StartedOn > ago(1h)
| extend ScannedRowsCount=toint(ScannedExtentsStatistics.ScannedRowsCount),
TotalRowsCount=toint(ResultSetStatistics.TablesStatistics[0].RowCount)
| extend Difference=ScannedRowsCount - TotalRowsCount
| where Text !has "summarize"
| project ClientActivityId, Text, ScannedRowsCount, TotalRowsCount, Difference
| order by Difference desc
Queries containing the SUMMARIZE statement are expected to have big differences between the scanned rows and resultset rows. It’s better to exclude them from this analysis. Even so, don’t take the result to the letter. If this means bad queries or not, depends a lot of the query which was executed.
CachedStatistics
Our queries need to use cache for a good performance. The more the query is capable to use the cache, the better.
We can check the field CacheStatistics to evaluate if the query is making a good usage of the cache or not. We need to understand the cache structure used in a Kusto database.
The Kusto database has two cache environments, called shards: Hot and Cold. The Hot shard is kept in a local SSD storage, while the Cold shard is kept in a storage with lower cost, but reliable.
Each one of the shards, Hot and Cold, has 3 values:
Hit: Number of bytes retrieved from the cache
Miss: Number of bytes not found in the cache
Retrieved: Total of bytes retrieved by the query
This is a basic query we can use to retrieve this information:
.show queries
| where StartedOn > ago(1h)
| extend HotHits=toint(CacheStatistics.Shards.Hot.HitBytes), HotMiss=toint(CacheStatistics.Shards.Hot.MissBytes), HotRetrieved=toint(CacheStatistics.Shards.Hot.RetrieveBytes)
| extend ColdHits=toint(CacheStatistics.Shards.Cold.HitBytes), ColdMiss=toint(CacheStatistics.Shards.Cold.MissBytes), ColdRetrieved=toint(CacheStatistics.Shards.Cold.RetrieveBytes)
| project ClientActivityId, Text, HotHits, HotMiss, HotRetrieved, ColdHits,ColdMiss,ColdRetrieved
| order by HotHits asc
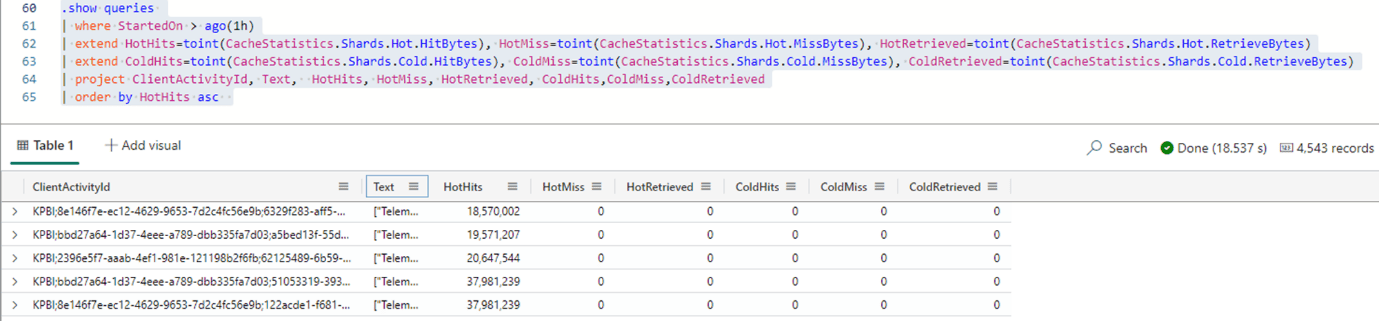
These are some analyses we can make over this data:
- High number of misses is a problem
- Low number of hits is a problem
- Cold Hit higher than Hot hit in too many queries is a problem
Cold and Hot Configuration in Kusto
You may have noticed the Cold values are completely empty on the images. Why?
The tables in a kusto database in Microsoft Fabric use Hot shard by default. The configuration is established by what’s called cache policy and the default policy is to keep 10 years of data in Hot cache.
In this way, the tables are configured for high performance by default, and we should change the configurations to save on the consumption and keep a good performance for the queries.
Using this query you can check the current cache policy:
.show table MyTable policy caching

Analysing the information we can define rules for Cold shards on each table and in this way save some consumption on the kusto databases.
We can change this configuration for each table:
.alter table MyTable policy caching hot = 30d
This syntax above only allows us to include in hot cache the most recent data. However, it’s also possible to include specific windows:
.alter table MyTable policy caching
hot = 30d,
hot_window = datetime(2021-01-01) .. datetime(2021-02-01),
hot_window = datetime(2021-04-01) .. datetime(2021-05-01)
Read more about cache and policies
Summary
We can carefully analyse our queries and optimize their syntax and the server cache configuration. Besides that, the configuration of caching policy between HOT and COLD had the potential to help you save some money.
This document contains proprietary information and is protected by copyright law.
Copyright © 2026 Red Gate Software Limited. All rights reserved


Load comments