Reporting on the Status of Clones During Database Development
Phil Factor uses SQL Clone, PowerShell and Visio to build a live 'clone network' diagram showing when there was last activity on each clone, and the number of object changes made to each one, alongside useful metadata such as the clone and image sizes, who created them and when.
SQL Clone’s dashboard gives plenty of summary information about the cloned databases, such as their size, when they were created, who by and its location. All the clone-specific metrics such as the image size are displayed somewhere in the console. However, during development, I might want to know more than this, such as the number of object (metadata) changes made to each of the clones since they were created, and whether anyone is actively any of the clones. If I know these details, then I can make sure that no changes are lost if a clone is reverted or refreshed and, in the spirit of enlightened harmony between Ops and Development, avoid deleting a clone if someone is using it.
So how do we get a detailed report on the current status of clones, and activity on them, if you are providing clones for development work? I didn’t think that such a thing was complicated enough to justify an article, but then I thought it would be more interesting if we had a PowerShell script that collected all the clone status data and then used it to refresh a live ‘clone network’ diagram, created using Visio! The idea behind the solution I present is that you want to set up a batch of clone databases as constant shared resources, such as for a shared test cell (i.e. databases with those particular names should and will continue to exist on those instances), but where developers want to be able to create, and then refresh, revert or remove clones, at will.
The live ‘clone status’ diagram
I once visited a very large ops unit for a Government department where one wall had a magnificent display of all the major nodes in the network, which changed colour according to whether that had any issues or had fired alerts that needed to be followed up. It was a very slick shop, and I’d always wanted something like that for databases.
Visio has a data graphic feature, well, sort of, which can be applied to shapes. For anything too complex, it’s a little too restrictive to be useful, but it has the advantage of being very quick to learn, so I thought I’d see whether it could produce a simple, live network diagram of my clones, with a pop-up report on the current status of each.
Figure 1 shows the results of my extensive efforts, in the form of a live clone network diagram with just three clones. The MyDatabaseOurs clone, at the top left, is selected and you are viewing the full status information, as gathered by the PowerShell script. The other databases on the same server aren’t clones but standard databases. The idea is that you could do status reporting on these at the same time, though this is not implemented in this example.
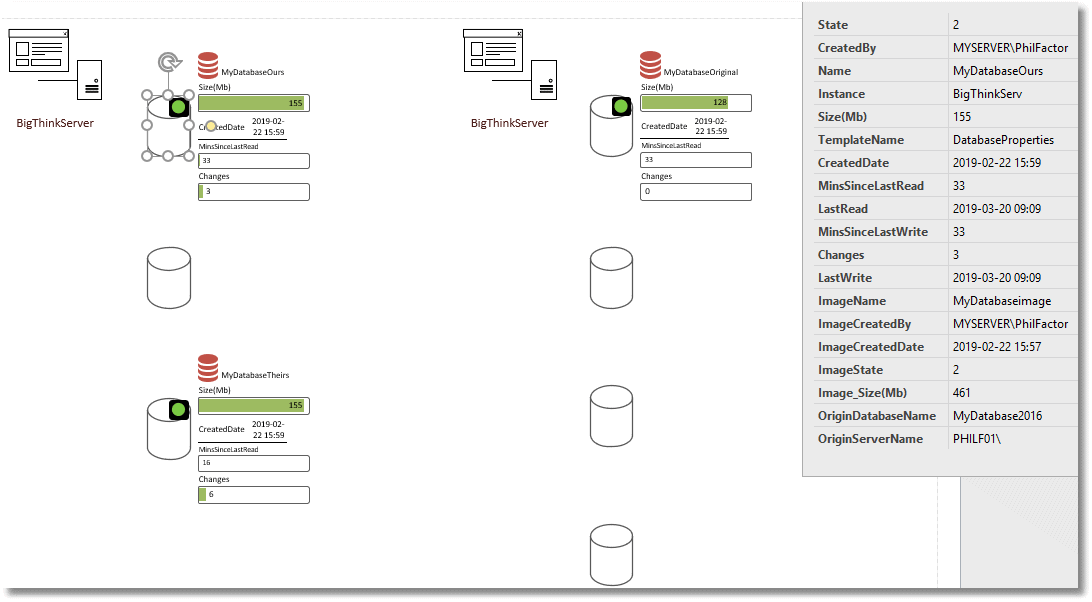
Figure 1
How it all works
This solution builds on previous articles in this series, which are all about managing clones during database development and testing work entirely by PowerShell scripting, leaving the console for reporting.
- Deploying and Reverting Clones for Database Development and Testing
- Scripting Custom SQL Server Clones for Database Development and Testing
- Safely Deleting Clones and Images during Database Development and Testing
These scripts were slightly odd in terms of style because they were all based on a central data model, or configuration file, written in the PowerShell object data notation. The scripts just iterated over all the clones described in the model and ‘did stuff’ such as reverting, modifying, deleting or updating the clones. I explain the data model in detail in the previous articles.
Similarly, the PowerShell script that collects all the image and clone metadata and status data, which I present later, relies on the same central, configuration data file, for the details of the current set of clones, and their parent images, for which it needs to collect the data. The configuration files also establishes the ‘original’ clone (a read-only clone that therefore reflects the the original state of the parent image), which allows us, by comparing, to detect the number of changes made to other clones created from the same image.
For each clone in the config file, the script collects from SQL Clone the metadata, identifying who created the clone and when, it’s size, and so on, along with similar data for its parent image. It also runs two queries, one to get the number of objects created or modified on the clone, since creation, and one to get recent clone activity (when it last had a read or write).
We run the PowerShell script as a scheduled task, every 10 minutes. For each clone, the result of each query is stored within a JSON object along with the clone and image metadata, and this is stored in a JSON array representing a JSON document and written to a table (RawStatusData) in our database. At any one time, the latest JSON document received is used to instantiate a view (more on this shortly) that is read as a table by Visio, with each row representing a clone, with its latest status data. We update the Visio diagram with the new status data, on a schedule (every 5 minutes, in this case).
Getting a live clone status diagram working
The experience of trying to create, and then periodically refresh, a ‘live’ Visio diagram was like trying to get several cats into a sack (although I don’t base that comparison on first-hand experience). I can predictably crash Visio Pro just by extending the External Data window. If you get something minor wrong, weird things happen, such as the labels expanding to astonishing widths, whenever one refreshes the diagram. Overall, you’d probably be better off using PlantUML, but this means a lot of learning, and Visio is perfectly serviceable, once you know the workarounds.
Visio allows only one table from the external data source per diagram, in this case one SQL Server table or view. I reckon that the best approach is to establish a single column in the table to be the key. ‘Name’ is an obvious one, though it should be a combination of instance and database name to be guaranteed unique.
You will probably have several types of object to represent, in this case instances, clones and normal databases. Every object type that is to be represented in the diagram must share a common data representation and display only the relevant subset. Fortunately, Visio will accept a view so it is perfectly OK to mangle your relational tables within the view to provide something that Visio can eat.
Figure 2 shows all the data that I wanted to collect.
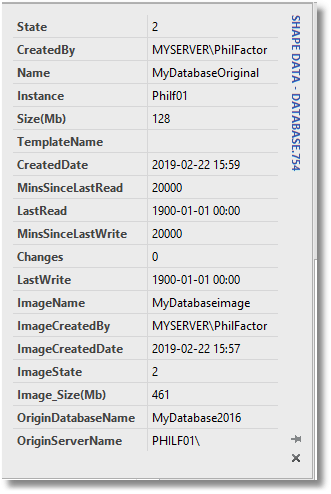
Figure 2
However, in terms of the visual elements and labels for each clone, I only wanted to show the most important data for the developers. This can be done with text, graphs or icon sets. The icon sets are valuable if you like effects such as lights going from red to green.
Figure 3 shows one clone. The green light tells us that it is online and working properly. We then see two bits of clone metadata (its size and when it was created), and then the next two labels, MinsSinceLastRead and Changes show the results of the two queries, for that clone, namely the number of minutes since it was last accessed, and the number of changes made to the clone, since creation.
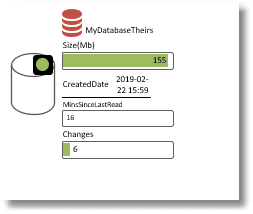
Figure 3
To get all this working, first, get into the Shapes windows, on the left, all the objects you wish to represent on the diagram. Next, establish the external data source, via the Custom Import icon on the Data tab of the office menu, and then read in the table, or view in our case.
Once everything is up and running, the External Data window will be populated with the current status data for each clone. In Figure 2, I have three clones, already linked to the data in the view. By starting Visio’s ‘refresh’ option, this will be updated every so often, at the time interval you specify.
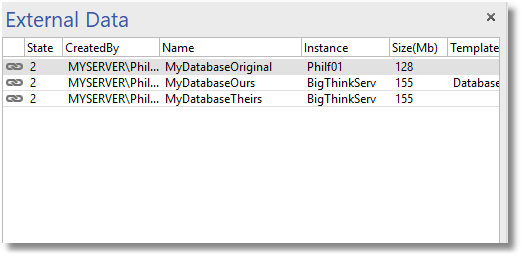
Figure 4
Then, you select the object you want to draw from the palette, in the Shapes window, drop it into the diagram link it from the External data window by dragging the link next to the row and dropping it on the clone. You then specify the visual elements, the representations of the data such as progress bars icons or text, as described above.
When the PowerShell task is running as a scheduled task, and you wish to add a clone to the diagram, just add a new clone to configuration data file. You will then see it in the External Data window, but without the link. All you need to do is to select the row and drag from the external data window into the diagram at the location you wish the new clone to be represented. Each new object in the diagram representing the clone will inherit all the data representations you’ve specified.
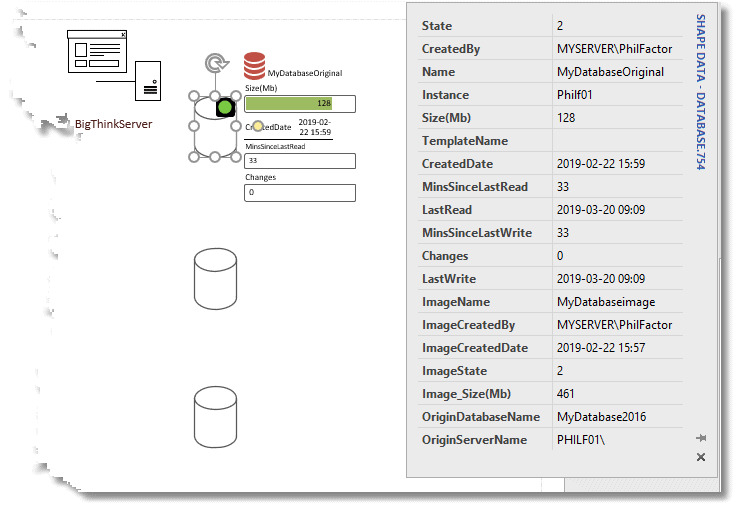
Figure 5
Deploying the table and view
There are various components to deal with. There must be a database, referred to in the script as the $statusDatabase to which the PowerShell script writes its report, and from which the Visio Diagram reads its data every so often (I’ve set it to five minutes).
In this database, create the table you use for collecting the reports from the scheduled PowerShell task. I’ve called it RawStatusData.
|
1 2 3 4 5 6 7 8 9 10 |
IF Object_Id('[dbo].[RawStatusData]') IS NOT NULL DROP table [dbo].[RawStatusData] CREATE TABLE [dbo].[RawStatusData] ( Data_id INT IDENTITY NOT null, collectionDate DATETIME NOT null, [Status] NVARCHAR(MAX) NOT null, Collector NVARCHAR(80) NOT null ) GO |
Each time the task runs, one new row is written to the table. The Status column stores the latest JSON status reports for each clone (a json document, representing an array of JSON objects, one per clone), and we also record the time and date of collection (collectionDate), and the name of the image (Collector). The idea is to have one ‘collector’ process for each image so identifying it with the image name makes sense This table provides us a history of all previous readings, for baselines and so on.
You can alter the name of this table, but then remember to enter the name of the table at the start of the PowerShell script, as StagingTableName.
|
1 2 3 4 5 6 |
$StatusDatabase = @{ "NetName" = "MyServer"; #the network name of the server "Database" = 'NetworkData'; #the name of the Database 'username' = 'PhilFactor'; #leave this blank for windows security 'StagingTableName' = 'RawStatusData'; } |
You also need a view, called CurrentStatus, which returns a table version of the latest readings for each clone. Every time Visio refreshes the diagram, it calls this View.
|
1 2 3 4 5 6 7 8 9 10 11 12 13 14 15 16 17 18 19 20 21 22 23 24 25 26 27 28 29 30 31 32 33 34 35 36 37 38 39 40 41 42 43 44 45 |
CREATE OR ALTER VIEW CurrentStatus AS SELECT [State], CreatedBy, Name, Instance SizeInBytes/1000000 AS [Size(Mb)], TemplateName, Convert(CHAR(16),CreatedDate) AS CreatedDate, MinsSinceLastRead, Convert(CHAR(16),LastRead) AS LastRead, MinsSinceLastWrite, Changes, Convert(CHAR(16),LastWrite) AS LastWrite, ImageName, ImageCreatedBy, Convert(CHAR(16),ImageCreatedDate ) AS ImageCreatedDate, ImageState, ImageSizeInBytes/1000000 AS [Image_Size(Mb)], OriginDatabaseName, OriginServerName FROM OpenJson( (SELECT status FROM RawStatusData WHERE collectionDate= (SELECT Max(collectionDate) FROM RawStatusData) ) ) WITH ( State INT, CreatedBy Nvarchar(80),--the Name Nvarchar(80), Instance Nvarchar(80), SizeInBytes INT, -- TemplateName Nvarchar(80), -- CreatedDate Datetime2 , -- MinsSinceLastRead INT,-- [Changes] INT, --the number of changes. LastRead Datetime2 , -- MinsSinceLastWrite int , -- LastWrite Datetime2 , -- ImageName Nvarchar(80), -- ImageCreatedBy Nvarchar(80),-- ImageCreatedDate Datetime2,-- ImageState int,--2, ImageSizeInBytes bigint, -- OriginDatabaseName Nvarchar(80), -- OriginServerName Nvarchar(80) -- ) GO |
To be comprehensive, and service a diagram with the full range of network components, the data table would have to represent database components such as servers, instances, images and databases, all within the single view. In the example, I’ve taken the less ambitious approach of representing just the clones. However, having JSON documents to hold the status of the clones, gives me the freedom to add other components besides databases later.
Reporting Queries
For each clone, the PowerShell script runs two relatively simple queries to report on the clone status. The first one is to see who is active on the clone, recording the number of minutes since the last read and since the last write.
|
1 2 3 4 5 6 7 8 9 |
USE master; SELECT COALESCE(MIN(DATEDIFF(MINUTE, last_read, GETDATE())), 20000) AS MinsSinceLastRead, COALESCE(MAX(last_read), '1/1/1900'), COALESCE(MIN(DATEDIFF(MINUTE, last_write, GETDATE())), 20000) AS MinsSinceLastwrite, COALESCE(MAX(last_write), '1/1/1900') FROM sys.dm_exec_connections A INNER JOIN sys.dm_exec_sessions B ON A.session_id = B.session_id WHERE database_id = DB_ID('Database_Name'); |
This is done to give you a better judgement of a good time to update a set of clones or to roll them back.
The second query is to see if any of the objects have been created or altered in each clone, since it was created.
|
1 2 3 4 5 6 7 8 9 |
SELECT COUNT(*) FROM sys.objects new LEFT OUTER JOIN OPENJSON(@json) WITH([Object_ID] int, Modify_Date datetime) AS original ON original.Object_ID = new.object_id AND original.Modify_Date = new.modify_date WHERE new.is_ms_shipped = 0 AND original.Object_ID IS NULL; |
In this query, I’m comparing the current clone with a read-only clone (called original), which represents the original version of the database, from which we created the image. The database’s metadata tells you when each object was last modified. If the clone is unchanged, these modification dates will match those of the original database. If the objects have been modified, or have been subsequently created, then they will not. The LEFT OUTER JOIN establishes the difference, giving the count of new or different database objects.
If you prefer not to use a reference clone, you can instead extract, from the original database from which the image was taken, the JSON document that contains the last-modification date of all the objects in the original database. We use JSON, and derive the table from it, because the original database’s metadata is unlikely to be reachable from within the query
Naturally, I use these reports just to indicate what is easily achieved. If you want other information, you can easily alter the script.
The PowerShell
Anyone who has seen the previous three articles will understand the PowerShell script because it merely reads the configuration data file and uses it to poll the databases registered as clones within the data. In other words, it doesn’t use SQL Clone’s version of what clones and images exist; instead it uses the config file to tell it what it supposed to be there. This way, it will tell you if the clone has been deleted. The only real complications are in accessing each of the development or test servers that hosts a clone to capture its status information and then writing all that data to our statusDatabase (which is used by Visio to display the status of the clones.
On the same server that hosts the statusDatabase, I add the PowerShell script as a task to the task scheduler, to run every ten minutes. The config file must be in the same directory as the script. You can find the CloneStatus.ps1 script, shown below, along with a sample config file, in my GitHub project for this series of articles.
It pays to test the script while logged on with the same user name you will assign to the task of running the scheduled script. Follow this up by running the PowerShell script in the command prompt before you put it on the task scheduler.
CloneStatus.ps1
Conclusions
SQL Clone is very robust, and its standard console reporting is fine for general purposes, but once you need to go beyond that, it is easy to script a solution giving more detailed information about the clones, using the SQL Clone PowerShell cmdlets.
I love a good network diagram. At a glance, if your brain is wired up like mine, you can see things that would take minutes of tedium to gather. Knowing my own failing, I have to say that I’d rather have a good visualization of the ‘clone network’, even if it takes time and effort to construct, because I know that otherwise I’d end up not bothering and trusting on luck. Visio is OK as a solution for this type of diagram, despite its quirks, and it is geared for people who are wary of hacking together a script that glues together several applications (which is most of us).
Tools in this post
SQL Provision
Provision virtualized clones of databases in seconds, with sensitive data shielded


