Monitoring your Servers and Databases: SCOM and Redgate Monitor
With simple integration, SCOM and Redgate Monitor combine breadth and depth, infrastructure-wide observability plus SQL Server insight. The result is faster incident response, smarter use of DBA time, and monitoring that scales with growth and new technologies.
Database estates are growing and evolving fast. Most IT teams now manage a mix of on-premises servers, cloud deployments, containers, and services spread across different platforms.
For IT managers, the challenge isn’t just ensuring that teams can collect the required diagnostic data for each server and every database, it’s ensuring they can act on it quickly and consistently. The monitoring strategy you choose directly affects both the long-term cost of ownership and the productivity of the people resolving issues that impact customers and the business.
Modern monitoring isn’t about choosing one tool over another. It’s about using the right tools for the right layers. Many organizations rely on System Center Operations Manager (SCOM) for infrastructure-wide monitoring. It’s powerful at breadth, but when it comes to SQL Server it often lacks the depth of a specialist tool. Redgate Monitor fills that gap. When working together, using simple and standard integration techniques, it creates a monitoring approach that scales, reduces incident response times, and frees DBAs to focus on planned work rather than firefighting.
In this article, we’ll explore how SCOM and Redgate Monitor compare, how they complement each other, and why combining them offers measurable value for both your teams and your business.
SCOM: Broad Coverage, Limited Depth
System Center Operations Manager (SCOM) is designed to provide a broad overview of the health and availability of the entire Windows-based IT infrastructure, from servers and applications to network devices.
To monitor SQL Server with SCOM, you need to install and configure the relevant management packs, depending on which versions of which SQL components (Integration Services, Reporting Services, and so on) you’re running. However, it’s a big leap from installing the packs to having a monitoring system that raises accurate, timely alerts and provides the detailed diagnostics needed to resolve complex database performance and security issues quickly.
Teams commonly report the following shortcomings:
- Missing and incomplete data – SCOM shows metrics like CPU usage, disk space, and memory consumption, but not the query-level diagnostics (execution stats, query plans, wait stats) that DBAs need to troubleshoot SQL performance issues.
- Over-alerting – without careful configuration, SCOM often generates floods of alerts. They may be frequent but lack the detail required to act, leading to alert fatigue and missed issues.
As a result, working with SCOM for SQL Server often becomes a continuous cycle: receive an alert, go hunting manually for the diagnostic data you really need, and then create custom scripts or add new rules to capture it. This customization quickly adds complexity, maintenance overhead, and cost, especially in large, diverse and growing database estates.
Finally, SCOM’s support for newer technologies, such as SQL Server 2025, Linux-based SQL Server deployments, containers, and cloud-native architectures, is often slow to come out, which can mean your coverage can lag behind your estate.
Redgate Monitor: Built for Database Observability
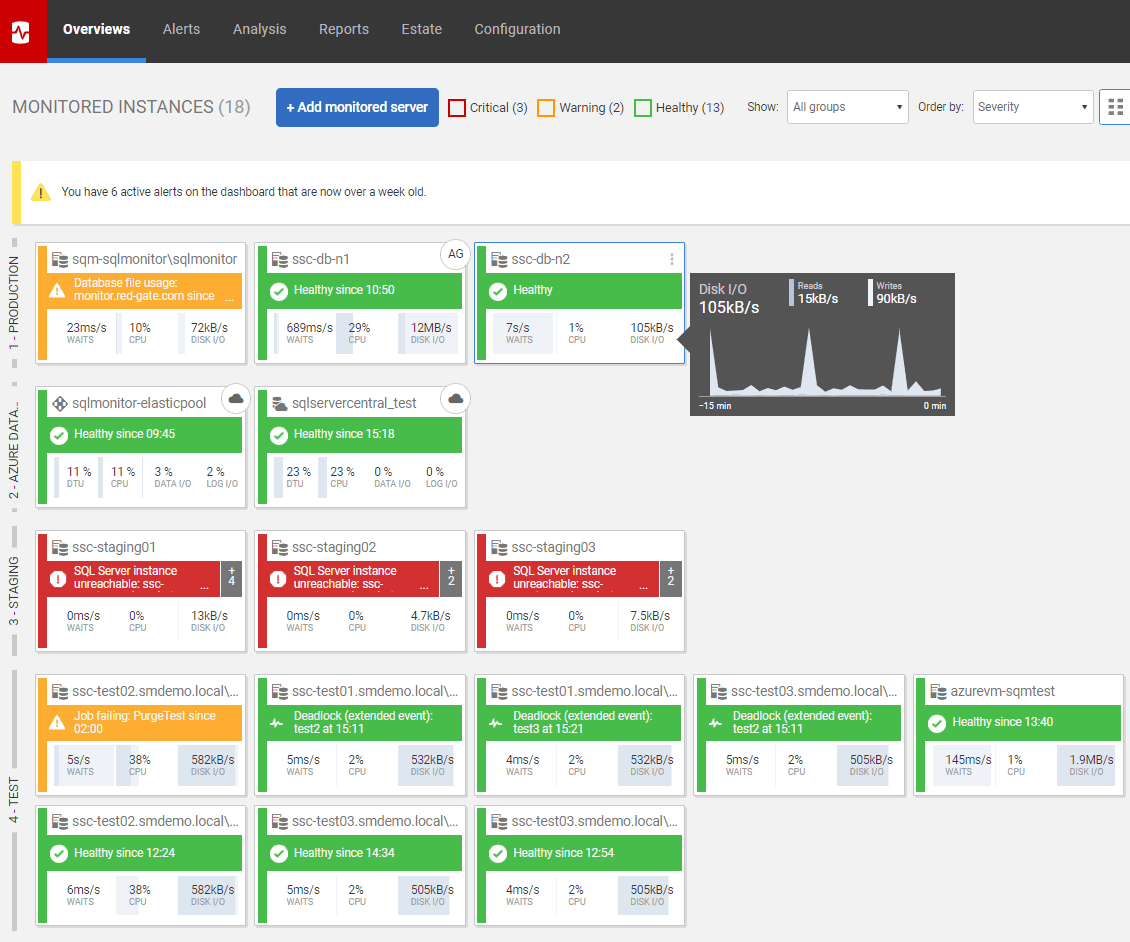
Redgate Monitor is designed to give IT teams and DBAs the depth of insight needed to keep database environments healthy, performant, and secure—no matter how complex or distributed your estate becomes. The goal of the tool is to give you a single pane of glass which allows you to get visibility into your entire estate regardless of what platform or where in the world your databases are hosted. Its observability features go far beyond basic up/down monitoring, providing a comprehensive view of server health, workload patterns, and configuration changes.
Instance Insights and Analysis
Redgate Monitor provides a clear overview of each database instance, tracking key metrics like CPU, memory, disk usage, and tempdb activity. This helps teams quickly spot bottlenecks, understand workload patterns, and monitor how configuration or access changes impact performance. With historical baselining, it’s easy to identify when something is starting to act out of the ordinary and respond proactively—before the situation devolves into firefighting.
Query Performance and Tuning
Drill down into query-level diagnostics to see which queries are consuming the most resources or causing slowdowns. Redgate Monitor highlights blocking, deadlocks, and waits, and offers actionable recommendations for tuning. This empowers DBAs to resolve issues faster and optimize performance across all supported platforms.
Estate-Wide Information
Redgate Monitor gives you a unified view across your entire database estate, whether your servers are on-premises, in the cloud, or in hybrid environments. Custom dashboards and flexible alerting keep teams informed about the health, performance, and usage trends of all monitored servers.
Beyond performance, Redgate Monitor also provides estate-wide visibility into changes in configuration and access. You can easily track how user roles, permissions, and server settings evolve over time, supporting compliance and audit requirements. This helps teams quickly identify when access patterns shift or when critical changes are made, making it easier to maintain security and respond to incidents.
With this estate-wide perspective, teams don’t just track performance issues, they can also demonstrate compliance, maintain visibility of security-related changes, and predictably manage growth.
SCOM + Redgate Monitor: Better Together
So, should you replace SCOM with Redgate Monitor? Not necessarily. SCOM gives operations teams the broad visibility they need over the health and availability of their infrastructure, covering servers, services, networks, and platforms.
But SCOM was built for breadth, not depth. When something goes wrong inside SQL Server, it often can’t provide the detailed diagnostics DBAs need, and it is very difficult to compensate retrospectively for deficiencies in the available data. The result is a trial-and-error approach to incident response, where teams respond to alerts but without the data and context to resolve the issue. Response times become unpredictable because they rely on a small pool of SCOM experts to “fill in the gaps” and interpret the data.
This approach doesn’t scale in a growing and increasingly distributed estate. Instead, let each tool do what it does best. SCOM provides the wide, infrastructure-level visibility your IT organization depends on and alerts the team to incidents, wherever they occur on the network. Redgate Monitor adds the SQL-specific intelligence your DBAs need to troubleshoot, optimize, and secure the database layer.
Together, and with simple integration and automation techniques, they deliver a more scalable, service-oriented monitoring strategy. The results are measurable:
- Lower MTTR – faster, more predictable incident response times, with a higher % of incidents resolved within SLA.
- Smarter use of DBA time – actionable alerts instead of noise, freeing up more hours for planned versus unplanned work.
- Future-proof monitoring – a solution that scales easily and keeps pace with change, enabling faster and safer adoption of new technologies and business platforms.
How Do we Integrate Redgate Monitor and SCOM?
Integrating Redgate Monitor with SCOM allows you to centralize alerting and incident response, ensuring that database issues are visible to your wider IT operations team. There are several ways to connect the two systems, each with its own strengths and use cases:
1. SNMP Traps
How it works:
Redgate Monitor can be configured to send SNMP (Simple Network Management Protocol) traps when alerts are raised. SCOM, as a mature infrastructure monitoring platform, can receive and process these SNMP traps, triggering workflows or notifications as needed.
When to use:
- Your organization already uses SNMP for other monitoring integrations.
- You want a standards-based, low-latency way to forward alerts from Redgate Monitor to SCOM.
Considerations:
- SNMP traps are lightweight but can be less flexible than other integration methods.
- You may need to configure SCOM to recognize and categorize traps from Redgate Monitor.
2. Webhook Alerts
How it works:
Redgate Monitor supports webhook-based alerting, allowing you to send alert payloads to any HTTP endpoint—including custom endpoints or middleware that can forward alerts to SCOM. If you have the SCOM webhook management pack, you can receive these alerts directly.
When to use:
- You want to leverage modern, flexible integrations.
- You need to enrich or transform alert data before it reaches SCOM.
- You’re integrating with cloud-based or hybrid environments.
Considerations:
- Webhooks can carry rich, structured data (JSON), making them ideal for automation.
- Requires configuration of endpoints and possibly middleware to bridge between Redgate Monitor and SCOM.
3. Monitor Enterprise API
How it works:
Redgate Monitor’s Enterprise API provides programmatic access to alert data, server status, and more. You can use PowerShell scripts or custom applications to poll the API for new alerts and forward them to SCOM using SCOM’s native PowerShell modules or REST API.
When to use:
- You need maximum flexibility and customization.
- You want to integrate alert data with other systems or enrich it before sending to SCOM.
- You have in-house scripting or development capability.
Considerations:
- Requires scripting or development effort.
- Enables advanced scenarios, such as correlating alerts, aggregating data, or triggering automated remediation.
Conclusion
There’s no single tool that can cover every layer of a modern database estate. Trying to stretch SCOM to do it all creates complexity, hidden costs, and bottlenecks. Likewise, relying only on a specialist tool would leave gaps in the wider infrastructure view.
The better approach is integration, not replacement. By using SCOM and Redgate Monitor together, you get the breadth of infrastructure monitoring and the depth of SQL-specific diagnostics. The result is a monitoring strategy that scales, delivers faster and more reliable incident response, and makes better use of your team’s time.
Tools in this post
Redgate Monitor
Real-time multi-platform performance monitoring, with alerts and diagnostics
You may also like
-

Article
Tagging in a monitoring tool: what is it and how can it benefit your team?
We recently released a minor version of Redgate Monitor, v12.1, that includes two exciting new features: ‘Tagging’ and a ‘Current Activity’ page. Find a post on the latter here. As you start to have responsibility for more than a handful of SQL Server instances, you’ll need to get more organised. Everyone around you benefits if
-
Article
Database monitoring in Financial Services: why this high-stakes sector requires a scalable, more comprehensive solution
IT and data teams in Financial Services must meet the more exacting demands for data integrity, compliance, performance, high availability and security that are expected in the sector. These demands require a dedicated, comprehensive, and scalable monitoring solution to help teams succeed in this high stakes environment.
-
Article
7 steps to effective database monitoring
Updated in 2026. There are a whole range of reasons you should monitor your server estate, from the essentials that support firefighting through to advanced modelling to help with proactive future planning. However, there are a few steps you need to take in order to ensure the monitoring is effective. In this post, we’ll show
-
Article
Finding and Tuning Expensive Stored Procedures using Redgate Monitor
Redgate Monitor's Top procedures list makes it simple to find the procedures having the biggest impact on performance, allowing you to prioritize your tuning efforts, reduce risk and keep pace with the requirements of your growing database estate.
-
Live training session
Level up your database insights | Identify and diagnose the impact of your deployments with SQL Monitor
In this 30-minute training session, Redgate Solutions Engineer David Ong will show how you can build insights and understand your server performance in an instant with fast deep-dive analysis using SQL Monitor.