Boost the performance of your applications with .NET profiling

Download 14-day free trial
A 2 minute overview of ANTS Performance Profiler, Redgate's .NET profiler

Introduction to ANTS Performance Profiler

ANTS Performance Profiler is a .NET profiler for desktop, ASP.NET, and ASP.NET MVC applications.

  • NEW: Profile your SQL queries and see execution plans
  • Find performance bottlenecks fast by profiling both the .NET code and the data access layer
  • Get rich performance data, right-down to line-level timings and expensive database queries
  • Save time going round in circles diagnosing and debugging – let the profiler do the hard work for you
  • Explore unfamiliar code bases

  • Enhanced data access profiling, with support for SQL Server, Oracle, MySQL, MariaDB, and PostgreSQL

Try it now, choose your version later.

Download free trial

1 Year Subscription

Standard

$366 per user

Improve application performance by profiling your own .NET code only.

Buy now

Pro

$549 per user

Identify performance bottlenecks in your own .NET code, as well as third-party code, framework methods, SQL Server queries and disk activity.

Buy now

1 Year Subscription

Standard

$312 per user

Improve application performance by profiling your own .NET code only.

Buy now

Pro

$468 per user

Identify performance bottlenecks in your own .NET code, as well as third-party code, framework methods, SQL Server queries and disk activity.

Buy now

1 Year Subscription

Standard

$294 per user

Improve application performance by profiling your own .NET code only.

Buy now

Pro

$438 per user

Identify performance bottlenecks in your own .NET code, as well as third-party code, framework methods, SQL Server queries and disk activity.

Buy now

20+

 users

Contact us for a personalized quote

0800 169 7433 

Features

All the performance data you need in a single .NET profiler

From .NET code to database

View performance data for both your .NET code and database requests made by the .NET code.

Profile database requests your application makes to any SQL Server, Oracle, MySQL (or MariaDB), and PostgreSQL database.

This is ideal if you're using an ORM.

Read more about our database profiling support, on Simple-Talk.com

Understand web requests

View rich data about outbound HTTP requests made by your application, including request and response header information.

See all the information in the context of the .NET code which caused the request to run.

File I/O performance

Get comprehensive performance information on your application's disk activity.

More features

Jump straight to the slowest activity

The call tree in the .NET performance profiler shows you data for every method and identifies the most expensive methods, database queries, and web requests.

Drill down to slow lines of code with line-level timings

Profile C# or any other .NET code line by line, with precise timing data so you can find issues at a glance. Expensive lines of code are automatically highlighted for quick visual inspection.

Look at your code's database interaction*

Understand how your .NET code makes database queries and how those queries perform. ANTS Performance Profiler supports SQL Server and Oracle databases, whether local or remote.

*Only available in Pro edition

Capture outgoing web requests*

Look at your application's outgoing HTTP requests. Get data about the request and response headers, and see what .NET code caused them to run.

*Only available in Pro edition

Immediate feedback on application performance

Use the interactive timeline to check the CPU usage of your .NET or ASP.NET application and highlight problem areas to focus only on the data that matters.

Group methods by HTTP request*

Code and database activity are grouped by HTTP request, exposing performance problems on specific web pages.

*Only available in Pro edition

C# profiling for async code

Understand the performance of C#5 async code. View activity in the context of the code you wrote, and see how work being done asynchronously is related to the async method which caused it to run.

Decompile third-party code*

Find bottlenecks in third-party components and framework assemblies using integrated decompilation, powered by .NET Reflector.

*Only available in Pro edition

NEW: Profile SQL queries

Relate timings for your individual lines of .NET code right through to the SQL execution plans. Find out exactly why your SQL query is running slow.

Learn more about profiling SQL queries

Compare product editions

Standard* vs Pro vs Bundle

ANTS Performance Profiler is available in a Standard or Pro edition, or as part of the .NET Developer Bundle

.NET Code ProfilingStandardProBundle
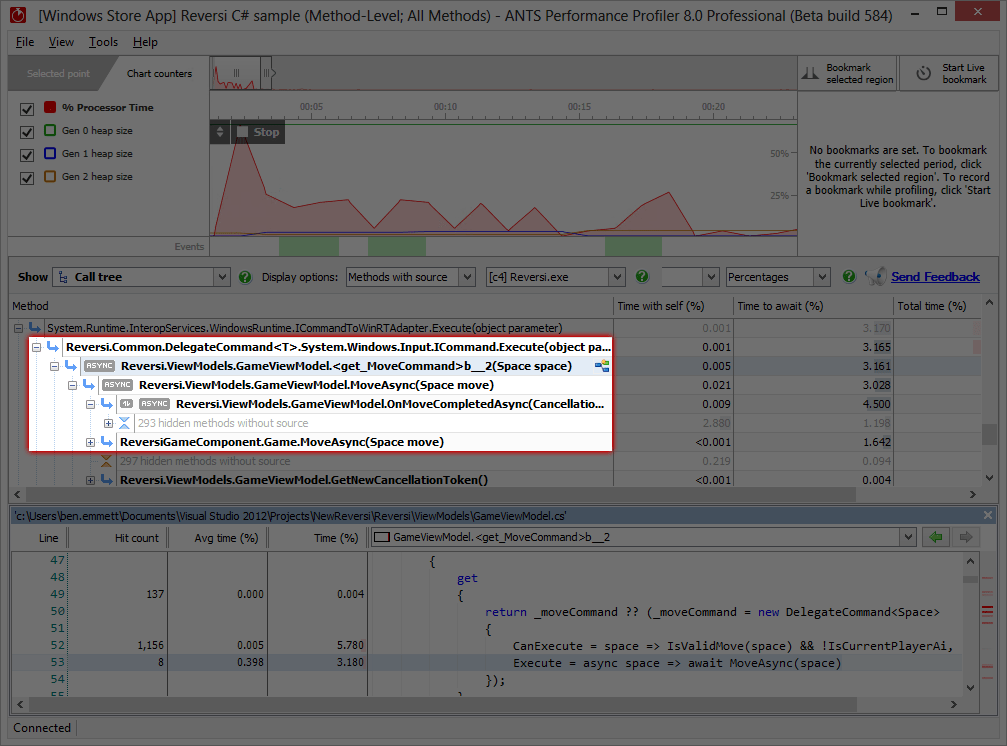
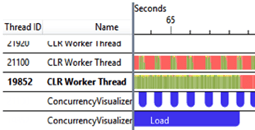
Profile .NET executables, ASP.NET web applications, Windows services, Silverlight, SharePoint, Windows Store apps, and COM+ server applications – including multi-threaded applications
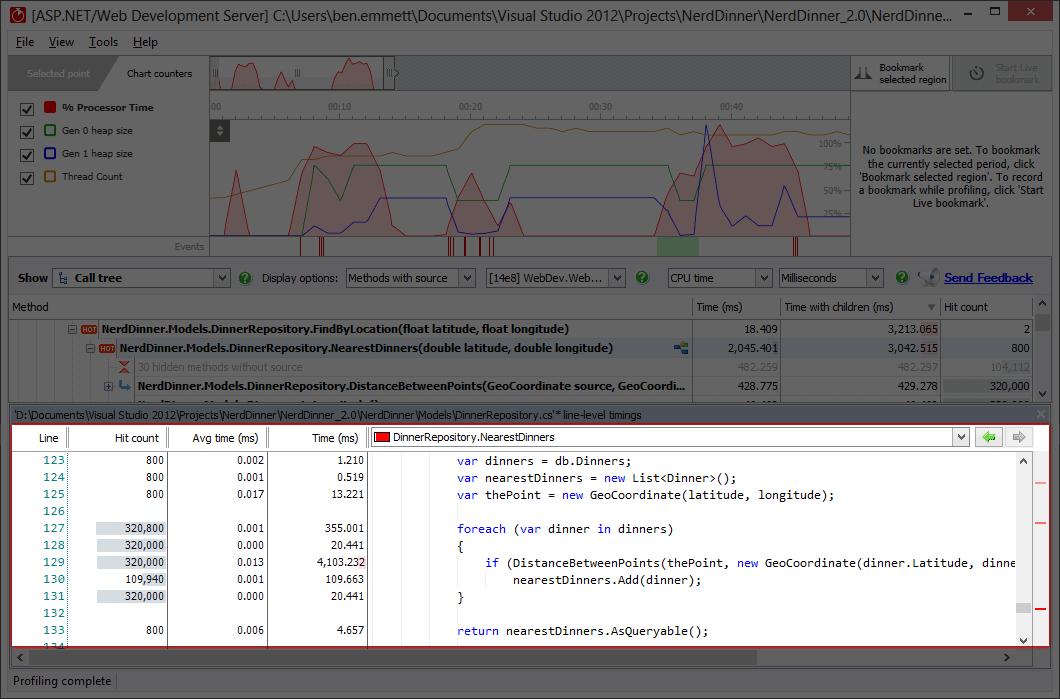
Line-level timings (instrumented profiling mode)
Sampling mode, for minimal-overhead profiling
Attach to a running process
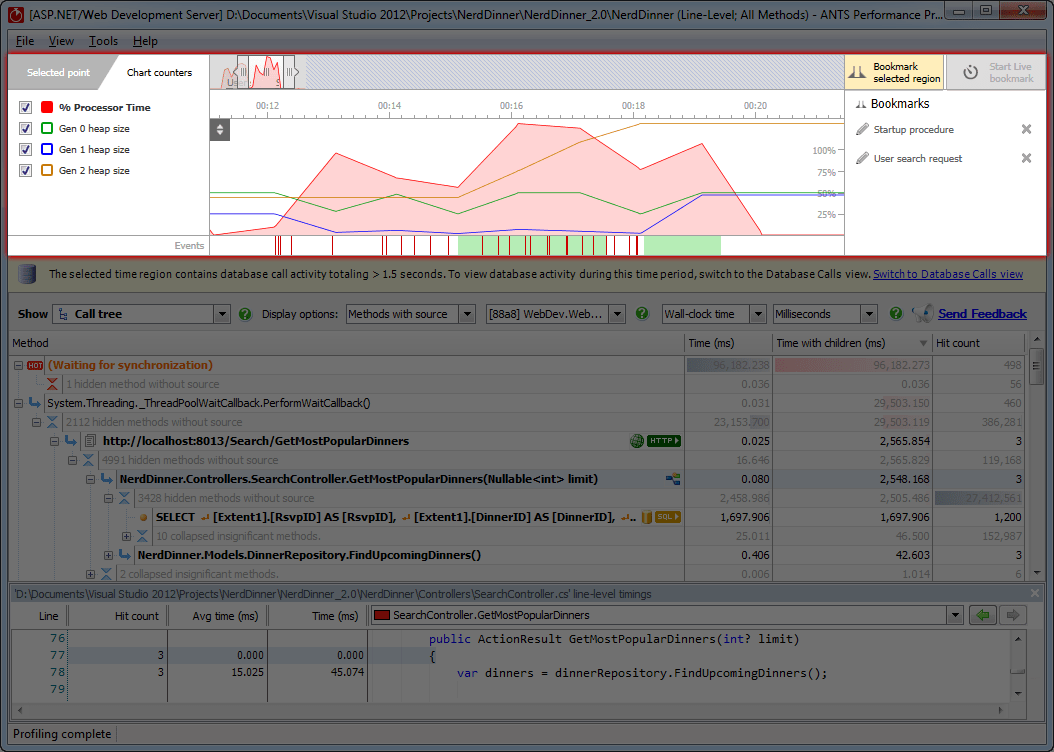
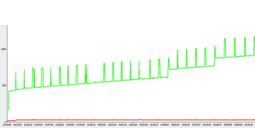
Timeline: get real-time feedback on your application's performance and select interesting regions to focus your profiling results on
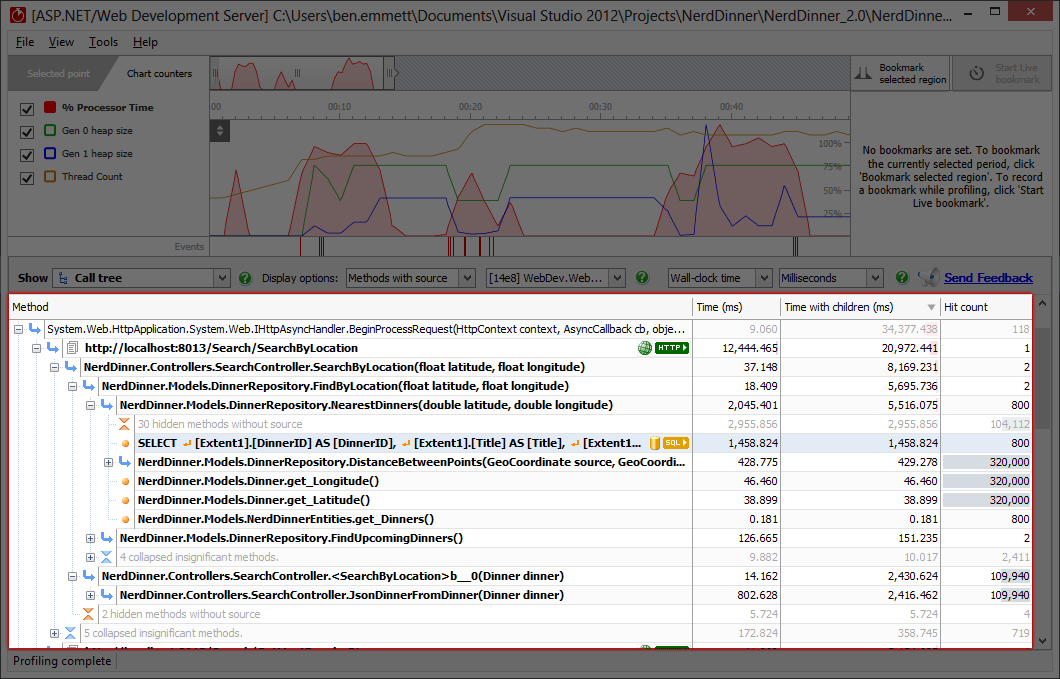
Call Tree: auto-expands to highlight the worst performing stack traces
Save and export profiler results
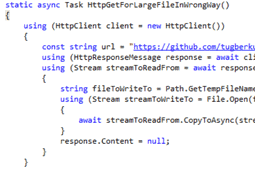
Profile C#5 async code
Call graph view: visualize all callers and callees for a selected method
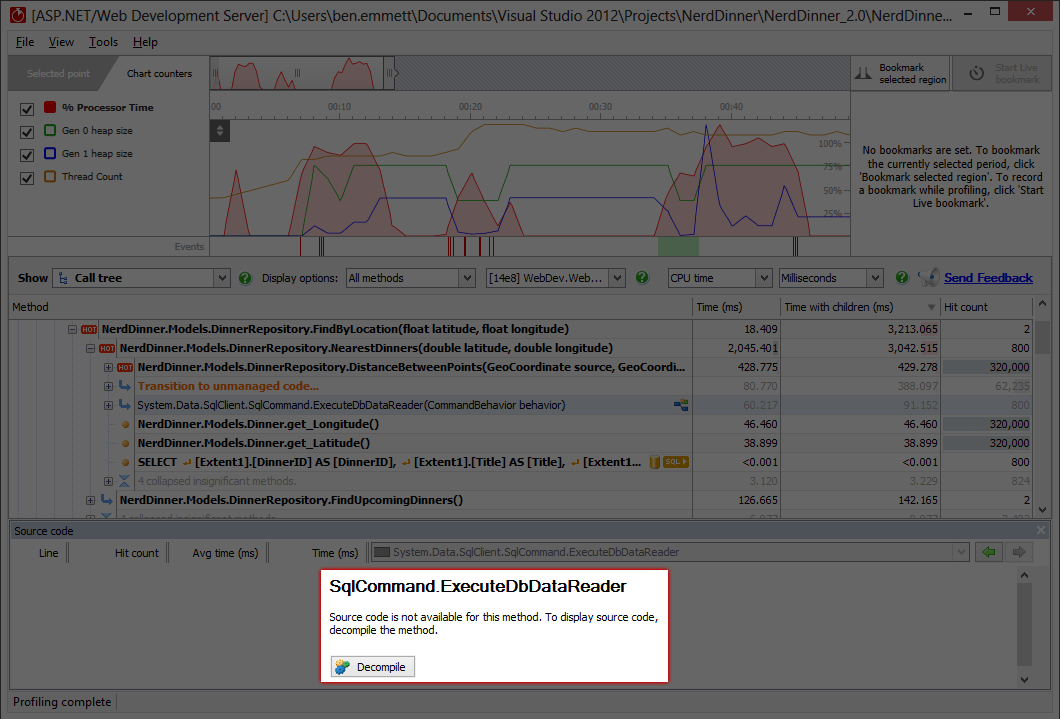
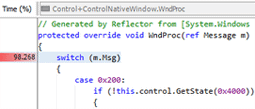
Integrated decompilation: get source code and timings for third-party and framework methods
Command-line access
Profile child processes
Database call profilingStandardProBundle
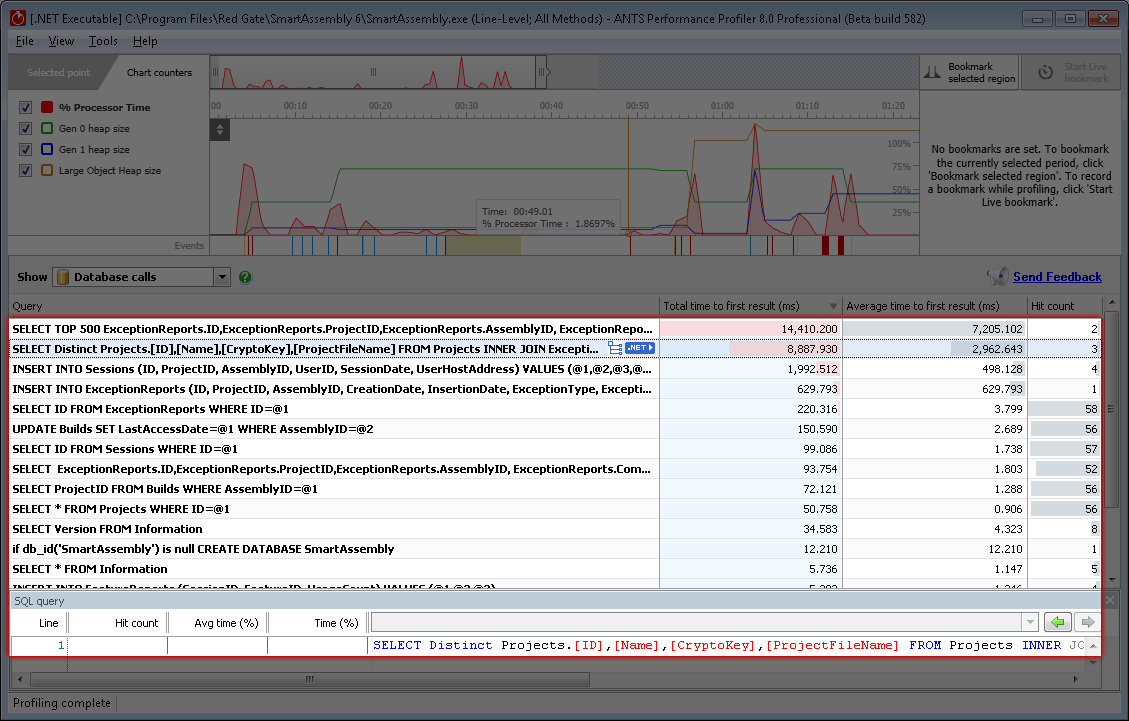
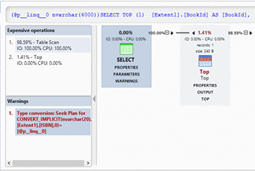
View SQL query strings, timings, and hit counts in the call tree
Profile calls to all SQL Server versions, including Express and Compact
Profile calls to Oracle databases
Profile calls to MySQL (or MariaDB)
Profile calls to PostgreSQL
Profile calls to databases hosted in the cloud (Amazon RDS and SQL Azure)
Understand what .NET code led to queries being executed
File I/O profilingStandardProBundle
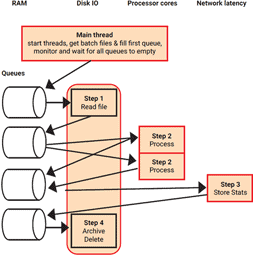
Dedicated file I/O view: see what files have been accessed
See disk read / write speeds for individual files
Incoming HTTP request groupingStandardProBundle
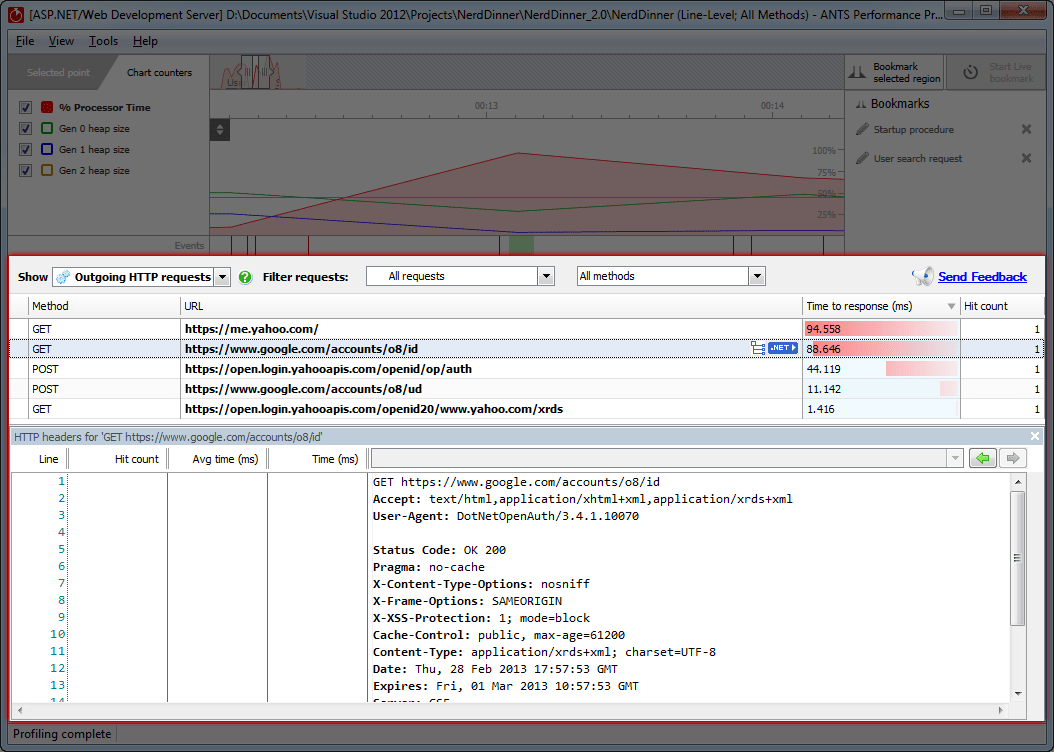
View timing data and hit counts for inbound HTTP calls to any ASP.NET application
See methods in your ASP.NET app grouped by the HTTP requests that triggered them
Investigate performance problems related to specific web pages
Profile moreStandardProBundle
ANTS Memory Profiler: find memory leaks and understand how your application uses memory
.NET Reflector VSPro: debug third-party code in Visual Studio

Open an edition comparison table

If you have any questions about which edition is right for you, feel free to email us at sales@red-gate.com


* The Standard edition can only profile methods with source code (i.e. it will not profile Microsoft framework methods or third-party components). It uses PDB files to find out if you have the source code, so you will need the PDB files to see your performance data.

What our customers are saying

Supported technologies

  • Profile any .NET application:
    Windows Forms, ASP.NET Web applications, WPF, Windows services, XBAP, SharePoint and Silverlight 4+.
  • In any .NET language:
    Allows C# profiling, VB.NET profiling, and F# profiling.
  • Supports:
    .NET Core and .NET Standard.
  • Supports:
    .NET 2.0, 3.0, 3.5, 4.0, 4.5, 4.6, 4.7. Compatible with Windows 10, Windows 8, Windows 7, Windows Vista, Windows Server 2008, and Windows Server 2012.
  • Supports web apps on:
    IIS Express, IIS 6, IIS 7, IIS7.5, IIS8 and ASP.NET Web Development Server (Cassini).
  • Supports 64-bit profiling
  • Support for running .NET 4 processes:
    Attach to a running .NET 4 / 4.5 / 4.6 process with no need to restart your target application or website.
  • Azure profiling:
    Profile worker and web roles running in the local Azure emulator
  • Cloud support:
    Install on Microsoft Azure and Amazon EC2 to profile cloud-hosted sites and applications. (You'll need to reinstall ANTS Performance Profiler any time a cloud instance is torn down.)
  • Visual Studio Integration:
    Compatible with Visual Studio 2010, 2012, 2013, 2015, and 2017.

.NET performance profiling resources

Articles

ASP.NET application performance improvements on Azure

ASP.NET, Azure Web Roles, and Azure SQL Database provide a great way to build highly scalable, data-heavy applications, without having to worry about the underlying infrastructure. In this walkthrough we'll take a look at profiling such an application.

Read the article

Is SQL Server killing your .NET application performance?

When a .NET application suffers from performance problems, it's common to assume the database is at fault. Ben Emmett examines why this often isn't the case, and shows how you can dig into .NET application performance and .NET's use of SQL Server with ANTS Performance Profiler.

Read the article

How to check third-party .NET code performance

To understand and improve .NET performance, you need to examine every aspect of your code. Bottlenecks sometimes lie in the way your code calls methods in third-party or framework assemblies. In this article, you’ll see how ANTS Performance Profiler can help you find these problems.

Read the article

Tips

.NET performance advice – 6 top tips

6 top tips on the best ways to start optimizing your code, from the .NET community.

Read these tips

How to improve the performance of ASP.NET applications

9 tips on speeding up the code-side of ASP.NET applications, from the .NET community.

Read these tips

.NET memory usage – 7 tips for better performance

7 tips for avoiding common pitfalls in .NET memory usage, from the .NET community.

Read these tips

How to improve .NET application performance – 11 tips

11 general tips on improving .NET application performance, from .NET MVPs and other members of the .NET community.

Read these tips

5 .NET code optimization techniques

5 advanced code optimization techniques from .NET developer Bartosz Adamczewski.

Read these tips

How to improve SQL Server query performance in .NET

14 tips on working with SQL Server, Entity Framework, LINQ, and other database technologies, as part of a .NET application.

Read these tips

Case studies

How ANTS Performance Profiler saved my hide

How Graham Russon, IT manager and senior developer at a financial institution in Cape Town, used ANTS Performance Profiler to resolve an urgent crisis with their payment processes.

Read the case study (PDF)

Content and performance drive Citywire website success

The financial news website Citywire, has high expectations for the speed of their site. A major factor in delivering that speed is finding performance bottlenecks and fixing them. For .NET analysis, Citywire turned to ANTS Performance Profiler.

Read the case study (PDF)

Videos

Understanding ASP.NET performance with ANTS Performance Profiler

ANTS Performance Profiler technical author Roger Hart demonstrates how you can look at performance information for specific web pages, and get a full understanding of your application's data access.

Watch fullscreen video

Profiling the performance of a .NET desktop executable

This video walks through profiling Redgate's SmartAssembly tool, showing how information on database queries and web requests can affect performance, as well as how precise code timing data helps you find your application's bottlenecks.

Watch fullscreen video

Webinars

Practical Performance Profiling

by Microsoft MVP Jean-Philippe Gouigoux

Jean-Philippe Gouigoux, Microsoft Certified Professional Developer and Technology Specialist, discusses performance profiling for .NET.

This presentation is a must-see for anyone who is new to profiling. Jean-Philippe discusses the basics of profiling in developer-level detail, covers client and server-side profiling, and illustrates classic issues and patterns by demonstrating profiling on a real world application.

Watch fullscreen video

Failure to launch: Code, Upload, and Explode

by Microsoft MVP Jeremiah Peschka

Before you load your valuable ASP.NET application into a rocket and aim for the cloud, let's do a sanity check. How do you handle bandwidth shortages that never let your app reach orbit? What happens if you need more speed to haul all these users up? If your uptime flames out, how can you easily plan for splashdown?

Moving an ASP.NET application to the cloud may not be as difficult as putting someone on the moon, but there are a lot of places where something can go wrong. In this session you'll learn how to handle the limitations of a purely virtual environment, measure performance and identify bottlenecks, and deal with the changing availability of resources

Watch fullscreen video

Licensing options

Floating license

Although we don't offer a floating license, Redgate's licensing model includes volume discounts. These are often more cost-effective than a typical floating license model, and they let all your users work with their tools at the same time, without waiting for a license to become free.

In the odd case that the volume discount scheme doesn't make life easier for you, we'll happily review your circumstances and work with you to find a better solution.

Personal licenses

We offer a 50% discount for a single personal license for personal use, hobbyist use, and home use. This license is not available to companies.

Open source licenses

We offer a range of free licenses for use on your open source projects. Find out more

Licenses for education, non-profit, charities, and start-ups

We've helped lots of organizations in these categories over the years, so we're very happy to discuss circumstances around our licensing. Please get in touch directly to see how we can help.

Student licenses

We're happy to provide free non-commercial use licenses for individual students in education, upon verification. Please contact us to apply for a license of this kind and to get more information.