


Getting started with ANTS Memory Profiler
A quick look at some of ANTS Memory Profiler's features, and how they take the pain out of memory profiling.
Find memory leaks and optimize memory usage in your .NET application

1 Year Subscription
$459 /user
Equivalent to $38.25/user/mo
1 Year Subscription
$390 /user
Equivalent to $32.50/user/mo
1 Year Subscription
$366 /user
Equivalent to $30.50/user/mo
20+
users
Contact us for a personalized quote
Automatic memory management in .NET makes development a lot easier, but it's still easy to introduce memory leaks into your application. For example, forgetting to unregister event handlers can lead to significant chunks of memory being held on to unnecessarily, but spotting that this is happening can be very difficult.
Trying to understand memory problems without a suitable tool can take hours or days, if you're lucky enough to know a problem exists. This is time which would be better spent fixing the problem.
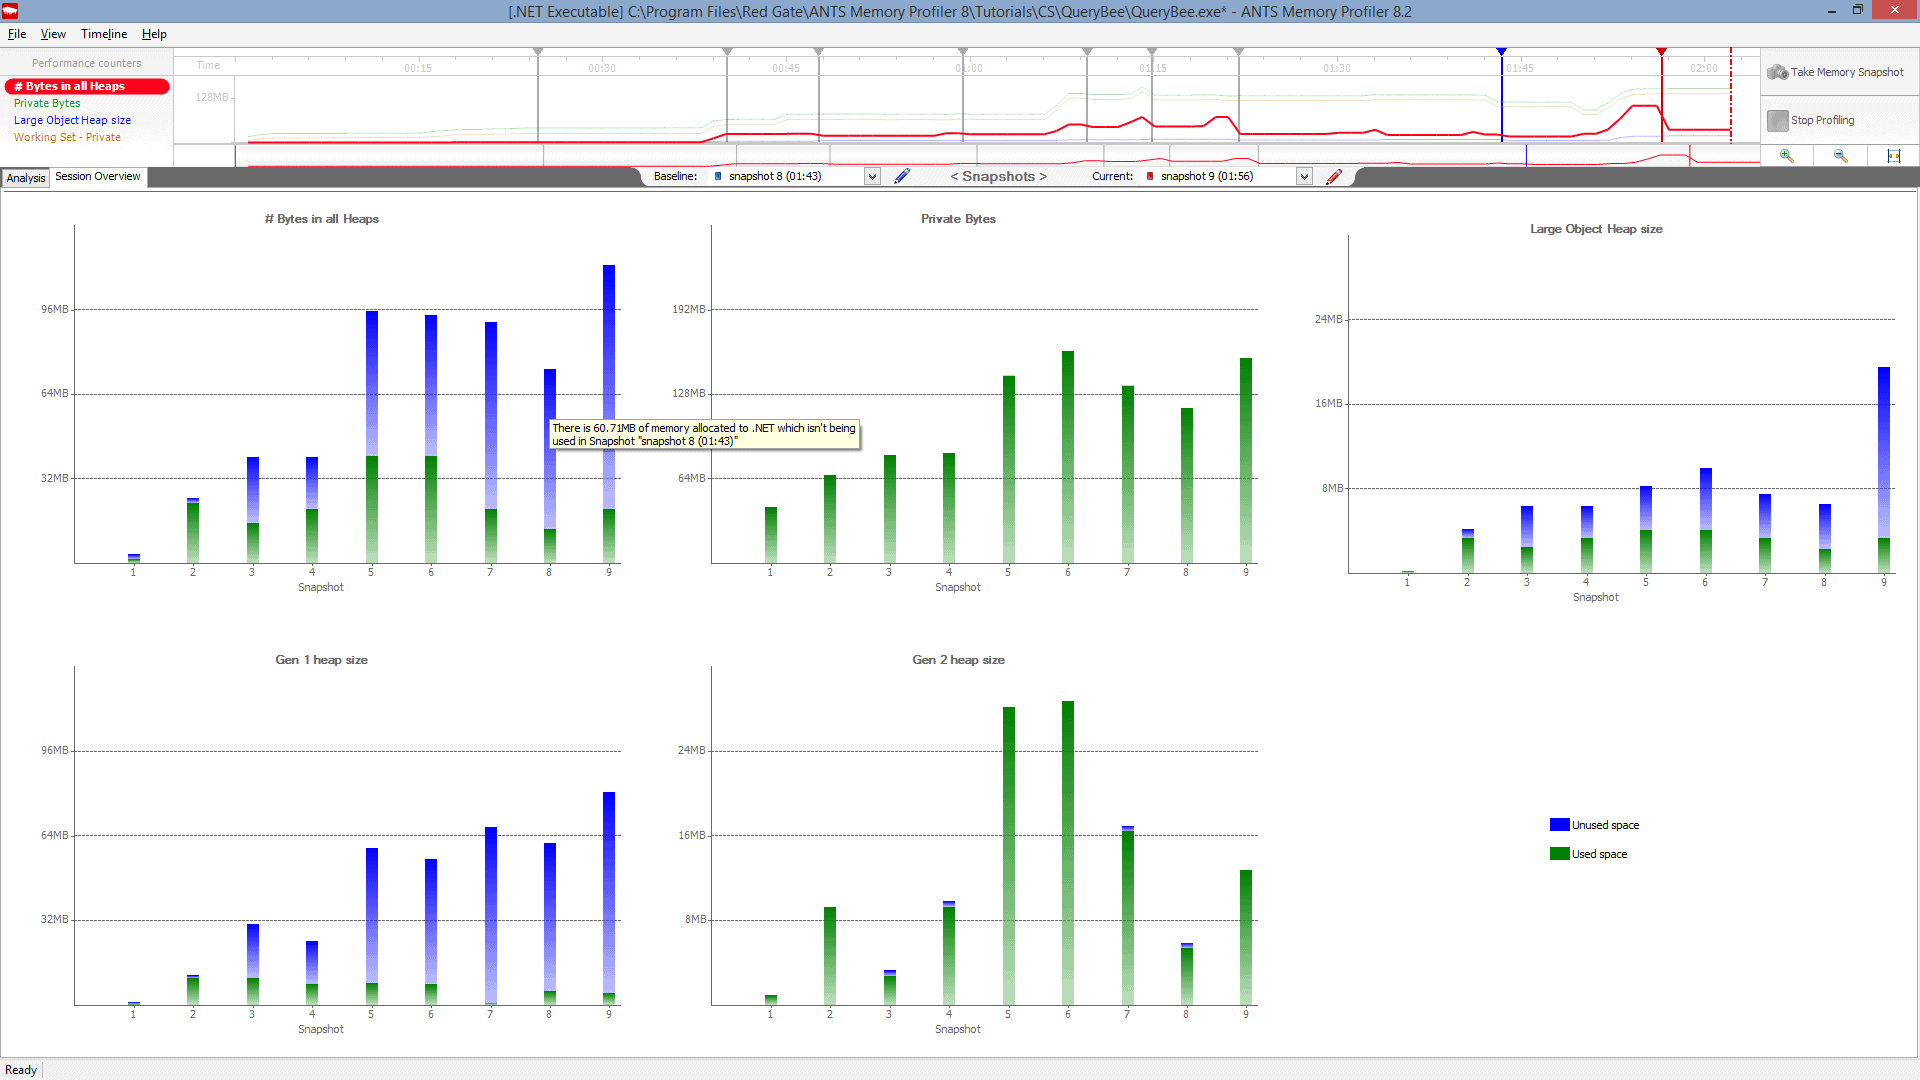
Obtain clear, meaningful results
Making it easier for you to interpret the information. Spend your time fixing problems instead of struggling to understand them.
Get results fast
With a footprint of less than 32 MB, the profiler can comfortably profile large, complex applications, with virtually no overhead. Take as many snapshots of the heap memory as you like, in seconds rather than minutes.
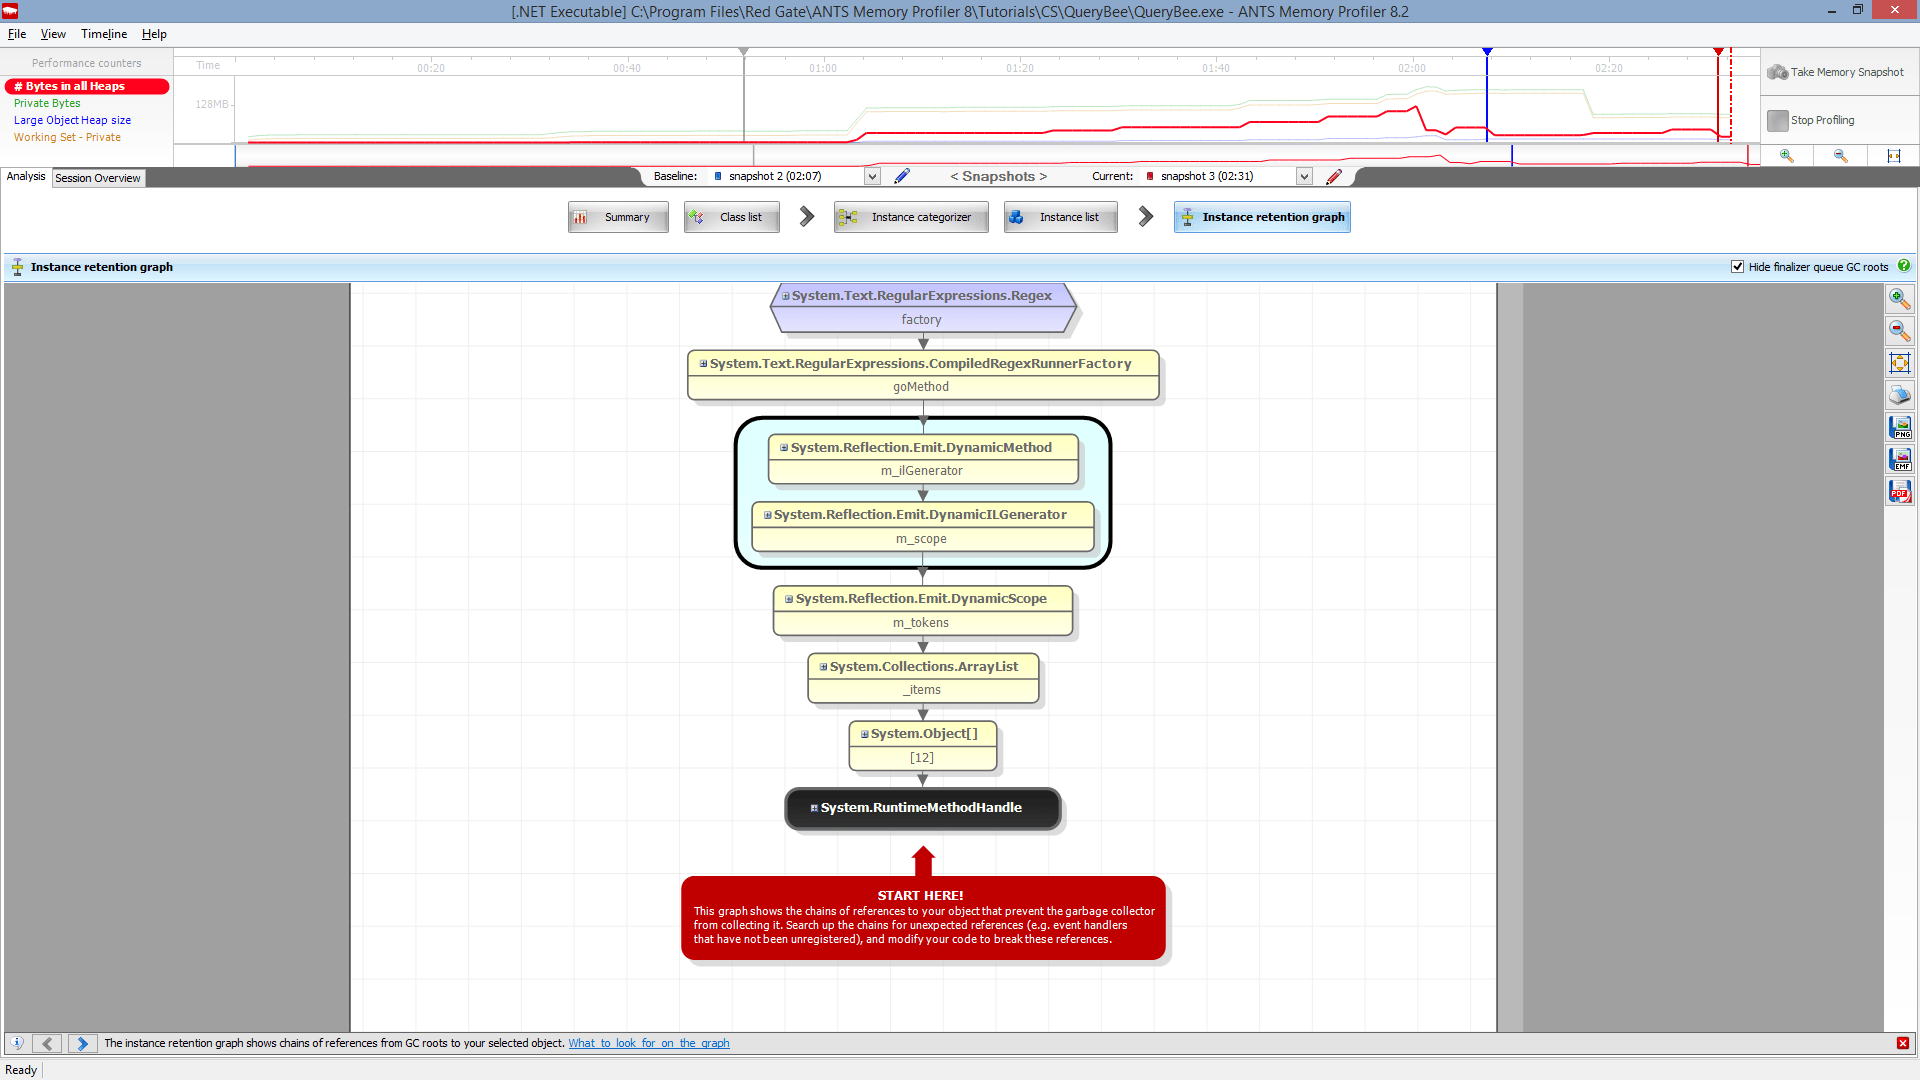
Quickly visualize the relationships between your objects
Use the instance retention graph to quickly see why your leaking objects are still being held in memory. You don't have to build a mental map to keep track of how objects reference each other.
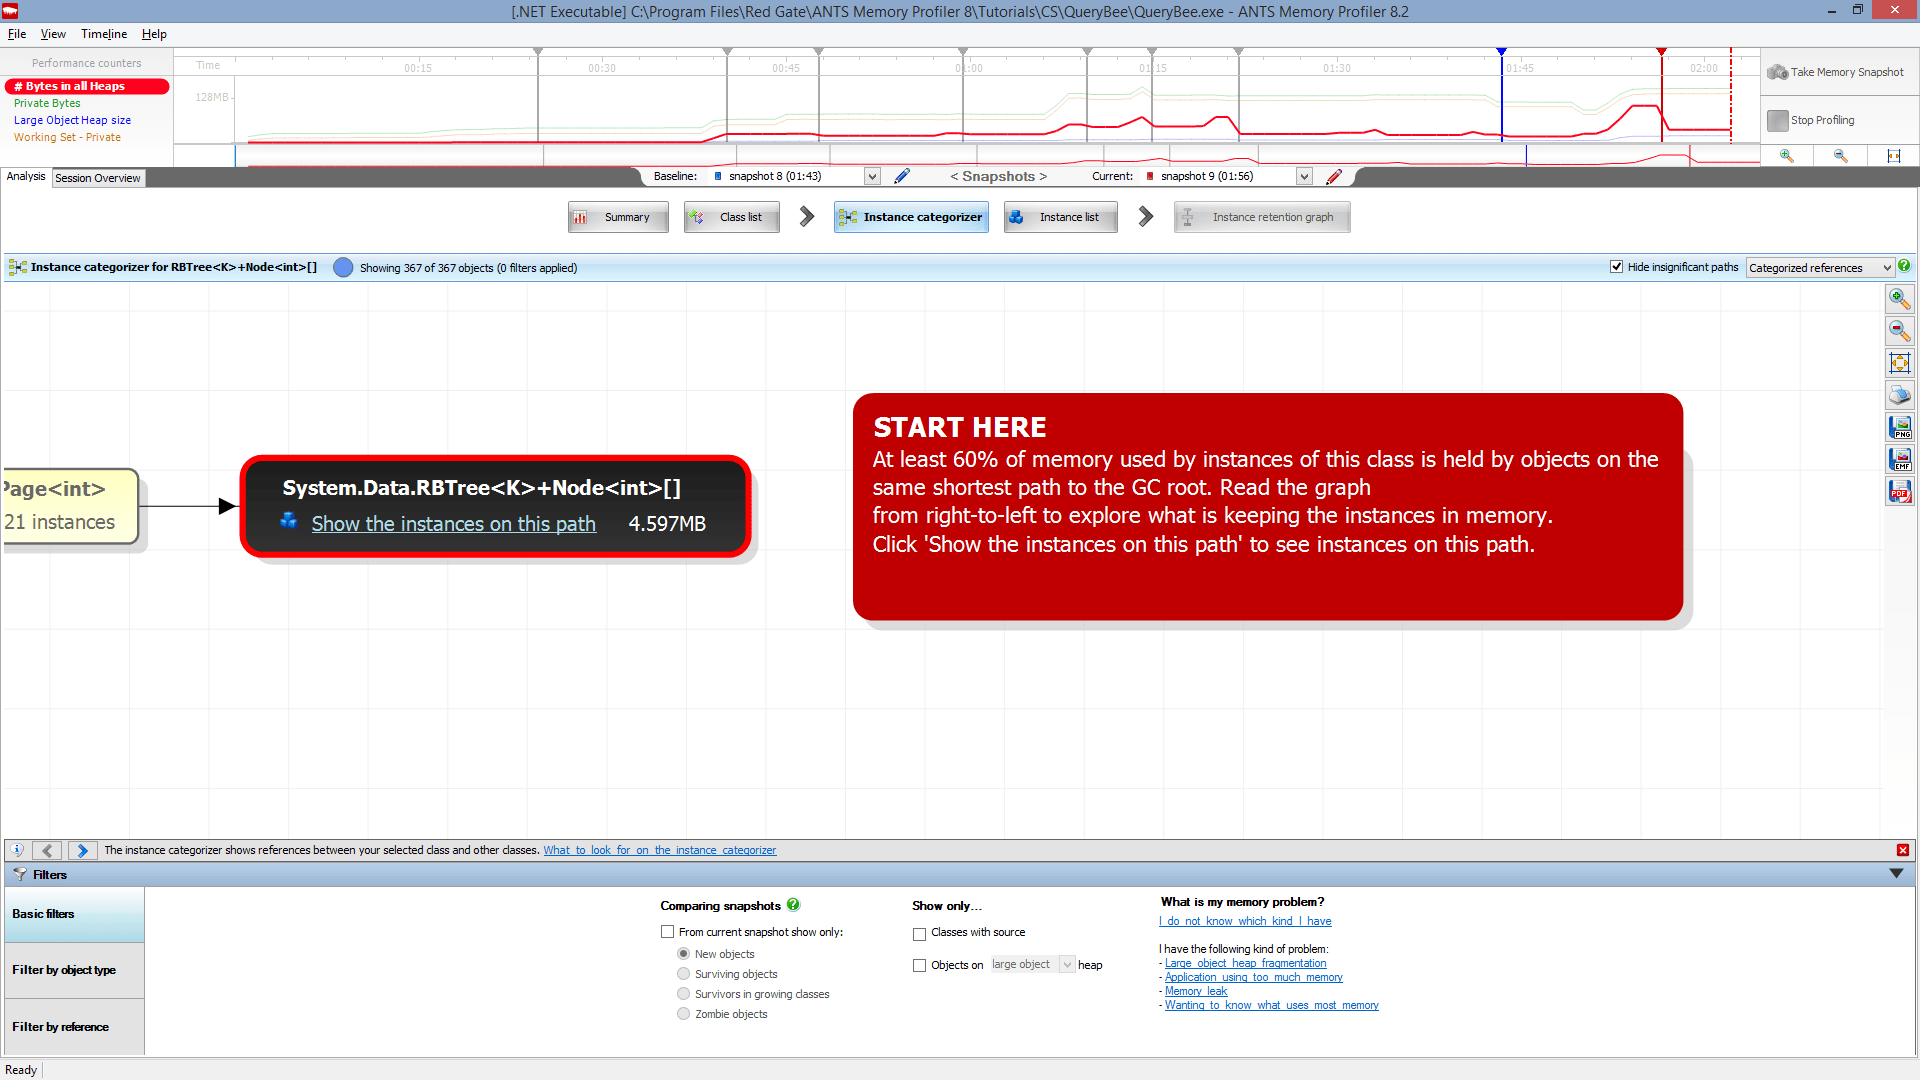
Go straight to the source of the problem
Intelligent analysis highlights the most likely causes of issues, often saving hours of problem-hunting.
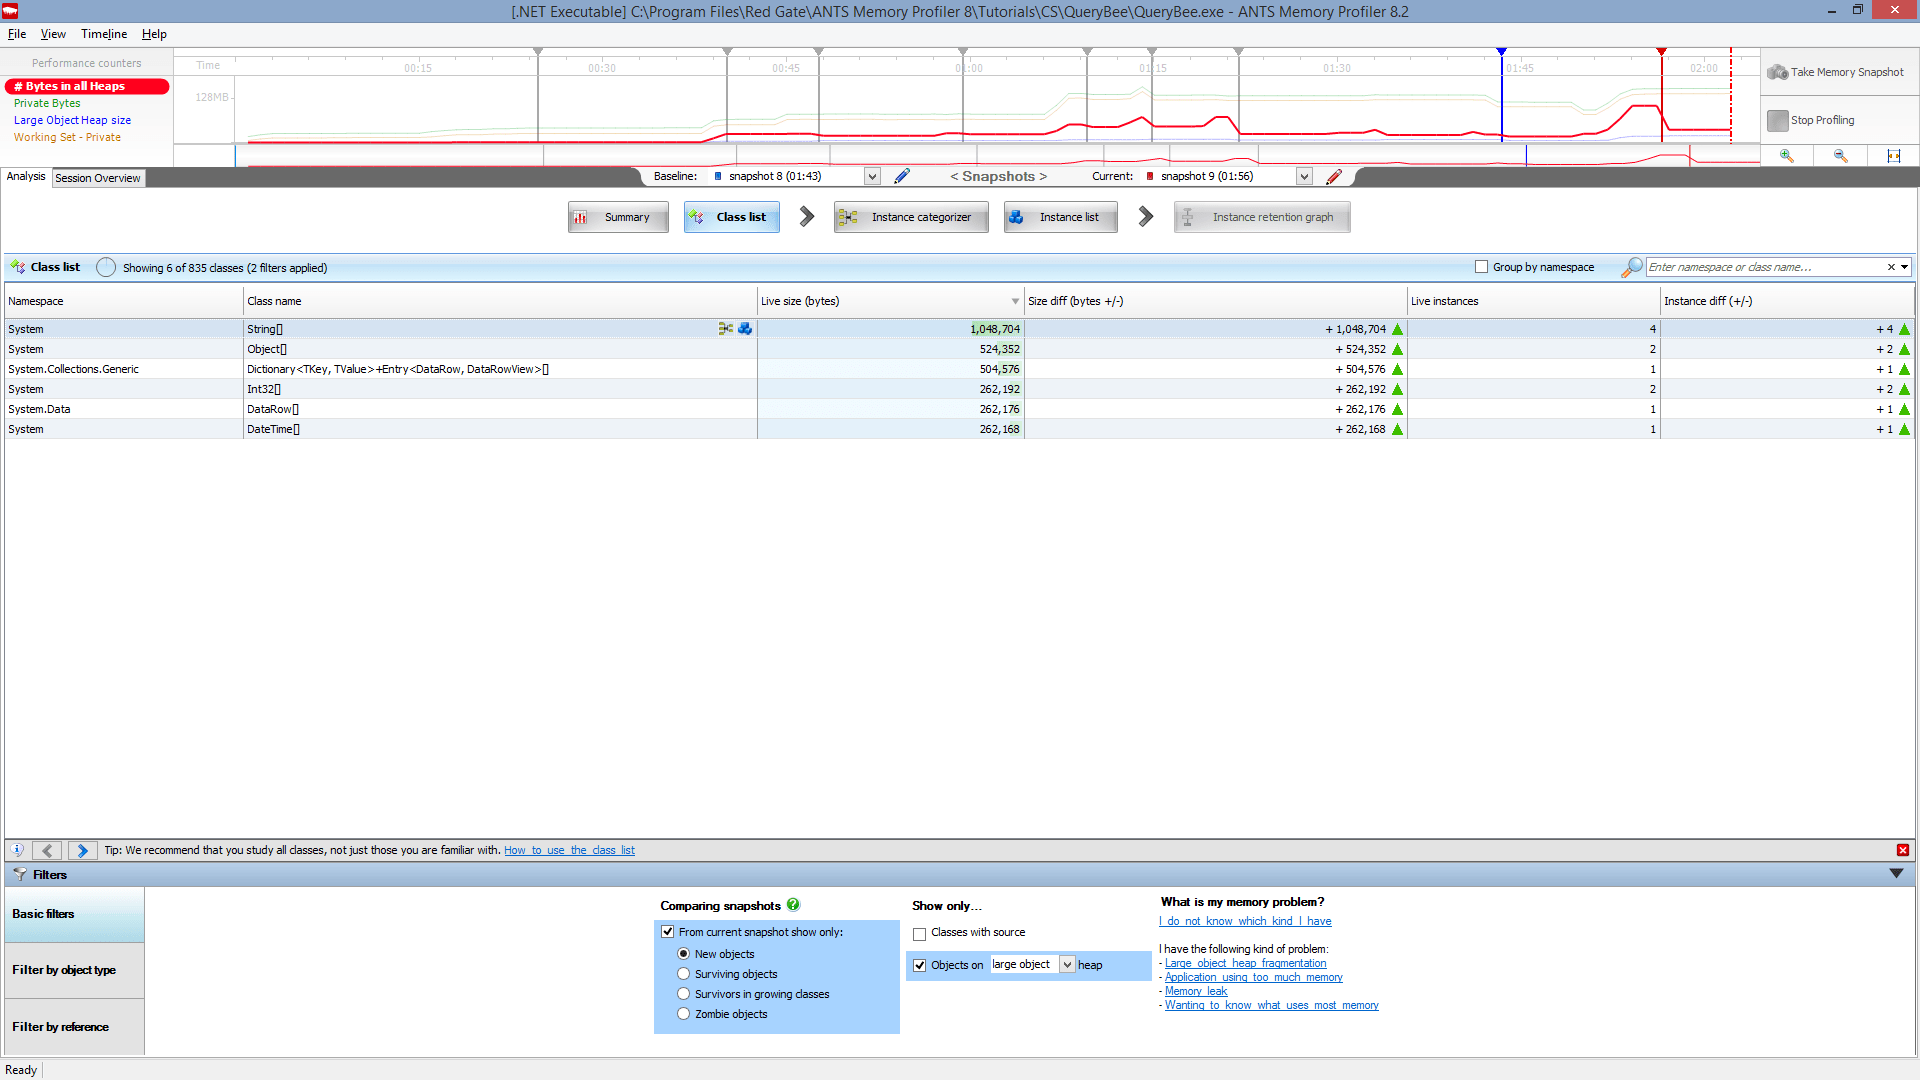
Zero in fast on the cause
Powerful filtering options allow you to cut through the noise, enabling you to quickly get to the root of even the most complex problems.
If you're programming in C# or VB.NET, and you need to understand where your memory is going, give ANTS Memory Profiler a try.
It takes five minutes to download, install, and start using the tool.
“ANTS Memory Profiler is an incredible, seriously awesome product. A great little tool for finding out what parts of your code take the most time/resources.
I have spent countless hours in debugging garbage collection issues, where I had no idea where I was heading. This tool showed me a systematic approach to debug web-based applications and find memory leak.
An issue that I was debugging for months was resolved in a matter of days. Thank you Redgate!”
“It would have taken me weeks to find the cause but, two hours after installing ANTS Memory Profiler, the problem was solved; it paid itself off on the first day I used it.”
“I was blown away by the interface and by the quality of information I was able to discover. I've since recommended it to a lot of friends.
This is an excellent program, even by Redgate standards!”
“I was trying to locate memory leaks in our WPF application and was evaluating tools for helping me with this task.
I was having a hard time finding a tool that performed reasonably well until I found the ANTS Memory Profiler. I downloaded the tool and it just works.
The performance and analysis capabilities are far superior to any of the other tools I have looked at and I find it very intuitive to use.”
“I just checked out that new memory profiler and that is freaking sweet!
We have a known memory leak that took me about 4 hours to find using our current tool, so I fired up the new version of yours and went at it like I didn't know the leak existed.
Not only did I come to the conclusion much faster, but I found another one!”
A quick look at some of ANTS Memory Profiler's features, and how they take the pain out of memory profiling.
In this webinar, Clive Tong discusses 5 of the most common misconceptions about .NET memory management. He's joined afterwards by ANTS Memory Profiler lead developer Andrew Hunter for a Q&A session, where they answer questions about how memory management works.

In this free 6-part article series, Ricky Leeks gathers together the top tips and techniques for understanding .NET memory management, including:
...and more.
Although we don't offer a floating license, Redgate's licensing model includes volume discounts. These are often more cost-effective than a typical floating license model, and they let all your users work with their tools at the same time, without waiting for a license to become free.
In the odd case that the volume discount scheme doesn't make life easier for you, we'll happily review your circumstances and work with you to find a better solution.
We offer a 50% discount for a single personal license for personal use, hobbyist use, and home use. This license is not available to companies.
We offer a range of free licenses for use on your open source projects. Find out more
We've helped lots of organizations in these categories over the years, so we're very happy to discuss circumstances around our licensing. Please get in touch directly to see how we can help.
We're happy to provide free non-commercial use licenses for individual students in education, upon verification. Please contact us to apply for a license of this kind and to get more information.
New report
The report sheds light on the current state of database management with industry insights.
Free book
From getting your first instance, to server configurations, we cover the PostgreSQL basics.