Security and compliance
Ensure data security and compliance with data masking, monitoring, and change traceability
Ensure data security and compliance with data masking, monitoring, and change traceability
Monitor and understand your databases with full visibility into performance and change
Build, test, and deploy database changes with confidence
Simplify and speed up database development workflows
Prepare reliable data foundations for AI initiatives
Simplify and secure database modernization across platforms
Control costs and boost efficiency in database operations
Simplify and speed up cloud database transformation

Automatic memory management in .NET makes development a lot easier, but it's still easy to introduce memory leaks into your application. For example, forgetting to unregister event handlers can lead to significant chunks of memory being held on to unnecessarily, but spotting that this is happening can be very difficult.
Trying to understand memory problems without a suitable tool can take hours or days, if you're lucky enough to know a problem exists. This is time which would be better spent fixing the problem.
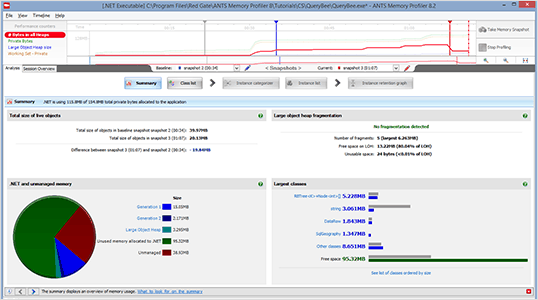
Making it easier for you to interpret the information. Spend your time fixing problems instead of struggling to understand them.
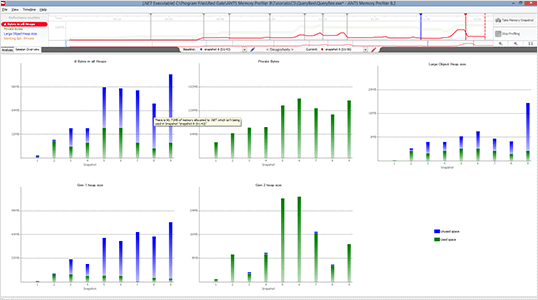
With a footprint of less than 32 MB, the profiler can comfortably profile large, complex applications, with virtually no overhead. Take as many snapshots of the heap memory as you like, in seconds rather than minutes.
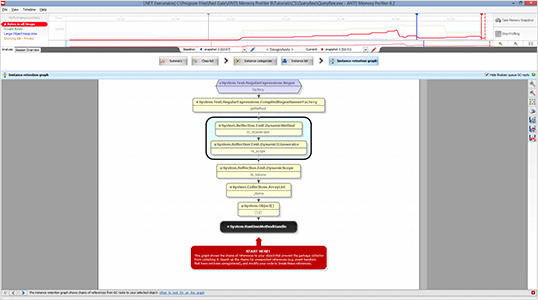
Use the instance retention graph to quickly see why your leaking objects are still being held in memory. You don't have to build a mental map to keep track of how objects reference each other.
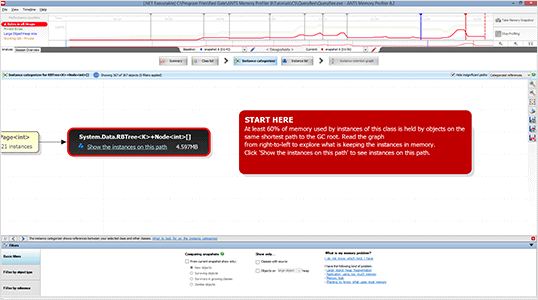
Intelligent analysis highlights the most likely causes of issues, often saving hours of problem-hunting.
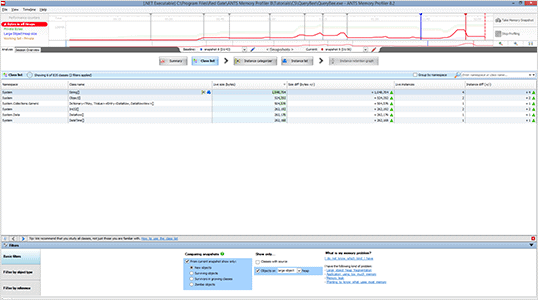
Powerful filtering options allow you to cut through the noise, enabling you to quickly get to the root of even the most complex problems.
If you're programming in C# or VB.NET, and you need to understand where your memory is going, give ANTS Memory Profiler a try.
It takes five minutes to download, install, and start using the tool.
Although we don't offer a floating license, Redgate's licensing model includes volume discounts. These are often more cost-effective than a typical floating license model, and they let all your users work with their tools at the same time, without waiting for a license to become free.
In the odd case that the volume discount scheme doesn't make life easier for you, we'll happily review your circumstances and work with you to find a better solution.
We offer a 50% discount for a single personal license for personal use, hobbyist use, and home use. This license is not available to companies.
We offer a range of free licenses for use on your open source projects. Find out more
We've helped lots of organizations in these categories over the years, so we're very happy to discuss circumstances around our licensing. Please get in touch directly to see how we can help.
We're happy to provide free non-commercial use licenses for individual students in education, upon verification. Please contact us to apply for a license of this kind and to get more information.


