Managing SQL Server Availability Groups is a bit like spinning plates. But with a good monitoring tool you can see at a glance the status of an Availability Group as a whole, and then go deeper into each replica and database.
Suddenly, you no longer need to spin plates.
Availability Groups provide a high-availability disaster recovery solution for SQL Server. Introduced in SQL Server 2012 as a feature of the Enterprise Edition, Basic Availability Groups became a feature of the Standard Edition in SQL Server 2016 as an alternative to database mirroring.
Basically, Availability Groups allow sets of databases to be replicated across multiple SQL Server instances, for the purposes of reporting and disaster recovery.
Unlike Mirroring or Replication, Availability Groups support automatic failovers, which makes them a solution for high availability. Data can be replicated synchronously or asynchronously to any number of secondaries, and SQL Server instances can participate in multiple Availability Groups.
So, protecting your databases using AlwaysOn Availability Groups adds an excellent tool to your disaster recovery and high availability capabilities. However, these capabilities bring with them the need to monitor the activities and functionality of the Availability Group. Redgate Monitor is a SQL Server monitoring tool that gives you the information and insight you need, so you always know exactly what's going on with your Availability Groups.
With awareness of operational and performance issues specific to AlwaysOn Availability Groups, Redgate Monitor covers the concerns and complexities Availability Groups can introduce, and provides monitoring coverage for all host machines and Availability Group replicas.
Redgate Monitor has Availability Group specific overviews, alerts, metrics, and wait types. The Availability Group overview shows at a glance the status and performance of an Availability Group and allows you to drill down into the replicas and databases. With 17 Availability Group-specific metrics and six new alert types, it gives you a complete picture of your databases allowing you to use your Availability Groups with greater confidence.
Speak to one of the Redgate Monitor Team who can guide you to the right solution:
01223 437 921 sqlmonitor@red-gate.com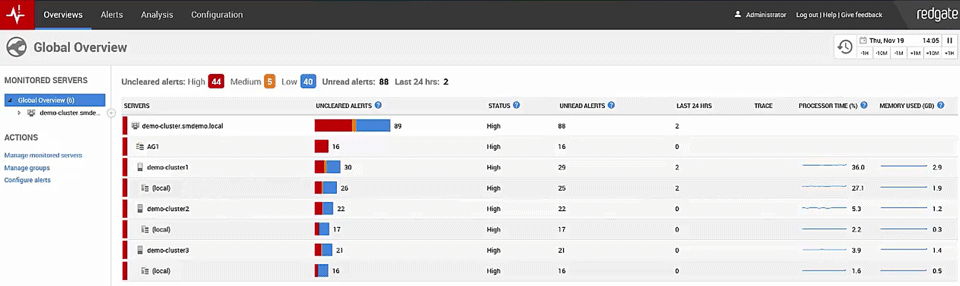
This is the opening Global Overview screen of the new Redgate Monitor and you can see that we've got a number of servers already under monitoring right now, including an Availability Group cluster. Now I can immediately drill on that Availability Group cluster and see what's going on.
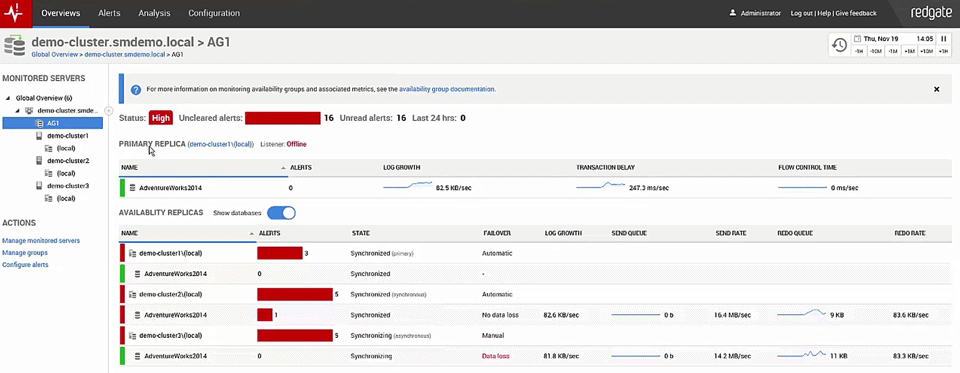
Now the Availability Group is occurring. There are some un-cleared alerts, things are going on: we've been letting things run just so you guys can see what's happening. We've got synchronous, asynchronous, we've got primaries, readable secondaries all already online and available. Some of them are hitting errors, but you'll notice that we've got monitoring in place to keep an eye on the Availability Group itself.
And you can see log growths occurring; I've got an artificial load on the system right now. We're seeing some transaction delays, but we are seeing the flow control time is keeping up really nicely so we're not seeing a whole lot of redos occurring that much. We've got the servers online, we are seeing some of them synchronized, it's occurring with no data loss, but we are seeing some data loss of some of the servers. We are intentionally setting this up so you're going to see some things going on. We're getting about 81kb/sec on the log growth right now so we're hitting a lot of stuff. It's just a PowerShell script running down here to generate a whole bunch of artificial transactions, I'm inserting data and deleting it immediately.
I've got flow control time running right here and you can see some flow control going on inside the redo and the redo rate is hitting as well on some of our secondaries. So I've got a good load going on this so you can see how it's behaving, how it's acting and the way things are occurring inside here.
Now the nice thing is, just as we talked about in the session, not only are we monitoring up time, not only are we monitoring availability on these things, but we are also monitoring performance. So if we drill down to the instance itself we can see the various databases, but better still we can scroll down here and we can see wait types.
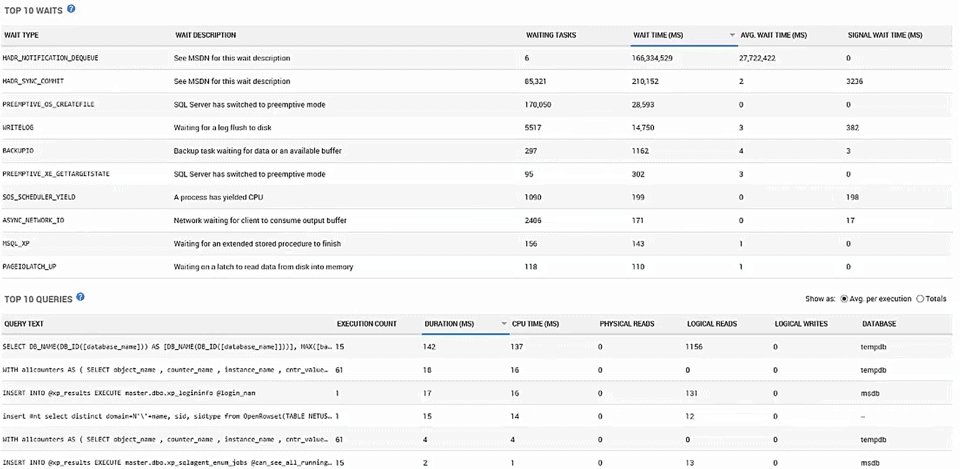
So we can tell that there have been some waits: There's an HADR wait occurring; we can see the HADR_SYNC_COMMIT waits are occurring somewhat and we can see what the average wait time is. So we could sort these if we wanted to: sort by the number of waiting tasks or by average wait time sort or sort by signal wait time so you can see you know if CPUs affecting it. But the whole thing is you can also look at the top ten queries. We've got everything set up so you can immediately know whether or not you've got a good Availability Group, whether or not your Availability Groups are online whether or not you're Availability Groups are behaving well. All of this is built into Redgate Monitor and it's available now.
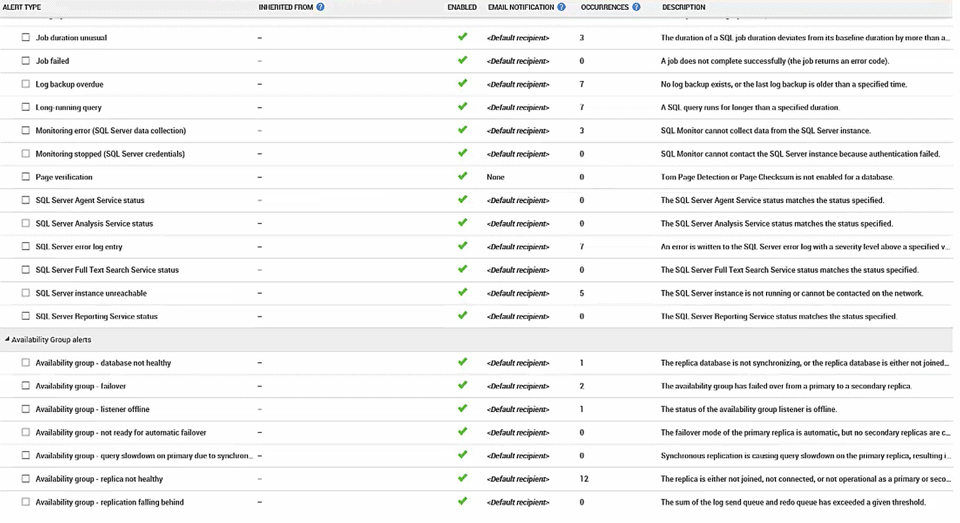
Further, if we go in here to configuration and we take a look at alert settings, scroll down through our various alerts, we've created a new set of alerts based strictly on Availability Groups. So we've got the "Database not healthy" alert, whether or not the group has gone into a failover event, if the listener's offline, if it's not ready for automatic failover. We've got a query slow down due to synchronous replication, we've got replica not healthy and replica falling behind.
So we've got a number of things already set up and available for you. And you can even see, if you look at the occurrences, because of the artificial load we've been putting on the machine, some of these have been firing. Now all of these are available, all of these are configured for you. You can turn them on or off. One thing I strongly recommend with any monitoring tool is that you go through and turn off a lot of the default monitors, so that you're not getting noise and you're just getting pure signal. But for the most part these Availability Group monitors are pretty applicable if you're doing Availability Group monitoring. So keep an eye on those. You can if you want to add your own Custom Metrics as well.
Now the metrics we're gathering we can even go over and look at in the Analysis screen. I've already got selected here the transaction delay. So you can see what's been going on for the last several minutes while I've been running this artificial load on the server. So we can take a look at it, we've got the actual monitor such as log sent rate, log send que, redo rate, redo que and these are all running really well in this particular server that we're looking at right now. But you can see that there that there is a transaction delay occurring because of the synchronous nature of the Availability Group. And so we're capturing all these metrics and we're showing them off to you and you can use them within your own system anyway you need to.
If we look at a different database we can, if we want to look at one of the other databases we can, and again you'll notice that the transaction delays there are nonexistent. Whereas the redo rates on these are higher because these are the secondaries and they're having to deal with the fact that there's other stuff coming in.
So one of the things you will find on Availability Groups it's not simply a monitoring situation where you monitor your primary, you do have to monitor your secondaries as part of the extended understanding of the health of the system. Now as far as these monitoring and analysis counters go one thing you should notice is over on the right here we have a lot of guidance to tell you what this thing is, what its monitoring, what values are also interesting for you look at, and even if there are additional things you should be looking at to understand how your system is behaving. So with all this guidance, with all these in built in monitoring, the built-in alerts, we've got it set up pretty much see you can right out of the box have your Availability Group monitoring online, alerted for downtime, pretty much everything you're going to need to maintain your system over time.


