Security and compliance
Ensure data security and compliance with data masking, monitoring, and change traceability
Ensure data security and compliance with data masking, monitoring, and change traceability
Monitor and understand your databases with full visibility into performance and change
Build, test, and deploy database changes with confidence
Simplify and speed up database development workflows
Prepare reliable data foundations for AI initiatives
Simplify and secure database modernization across platforms
Control costs and boost efficiency in database operations
Simplify and speed up cloud database transformation
"Wow, things seem to be running so much faster. What changed?"
Truthfully, that's not the kind of call I expect to receive often, as a DBA. However, it is the type of call that we would all like our work to provoke, and just every now and again, it does happen.
On this occasion, having seen the performance of one of our databases deteriorate over time, we in the operations team had worked collaboratively with the developers on the latest round of database changes, and made suggestions that we thought would help improve performance and also make the changes easier to deploy.
Critically, before we deployed the changes, we'd captured baselines for several important SQL Server performance metrics, over the course of the preceding weeks. It meant we knew exactly what resource usage looked like on the server before the changes, and could do a like measurement post-deployment, and so gauge accurately the precise impact of our work on server resource utilization.
As a result, not only did we receive anecdotal evidence of the positive outcome, in the form a call from a happy user, we also had hard metrics to show our manager, and we were able to take at least some of the credit for it as a team.
Erin Stellato describes a baseline very succinctly as "a point of reference from which change can be measured". Let's say a user reports that the performance on their application or report seemed slower than normal that morning. Was it? And if so, what changed? Was the number of user connections abnormally high over that period? Were there any unusual patterns in CPU, IO or memory use? Or did someone in operations change a server setting? These are all very hard questions to answer, unless you have baselines against which to compare. In order to know whether, for example, CPU usage was abnormal, over a certain period, you need to know what "normal" looks like; in other words, you need to have saved somewhere a baseline measurement of what CPU usage looks like over a comparable period, under your normal server workload.
We can capture baselines for a whole range of performance metrics, as well as other conditions. For example, we might take regular baseline measurements for:
sys.dm_os_performance_counters, at regular, known intervals, so we can compare the values of various counters values across periods.sys.dm_os_wait_stats DMV daily to look for changes in the most common reasons why SQL Server sessions had to wait before obtaining access to a resourcesys.database_files or sys.master_files or the sys.dm_db_file_space_usage DMV (SQL 2012 and later).sys.configurations), as well as database (sys.databases) and server property (serverproperty) values, so we can pinpoint exactly when configuration changes occurred, and correlate them to variations in behavior or performance.As a simple illustration, consider the following two 'snapshots' of wait statistics for a SQL Server instance, each obtained by querying the sys.dm_os_wait_stats DMV (the statistics were cleared at the end of each day).
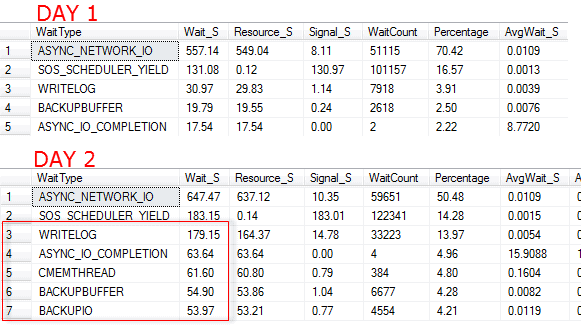
Figure 1 – results from querying the sys.dm_os_wait_stats DMV
Viewing either 'snapshot' in isolation, we may be concerned by some of the wait types we see, but have no way of knowing if this is abnormal for this server. It's only by being able to compare them that we can see clearly that there was abnormal activity on Day 2. Many of the same wait types appear in both snapshots, but all the wait times are higher on Day 2, and in particular those related to I/O latencies, such as WRITELOG, ASYNC_IO_COMPLETION, and the backup-related waits are significantly increased.
The DBA may want to review the scheduled backup jobs, find out which backup was running over this period, and why it caused longer-than normal waits. It would also be worth investigating the I/O performance of the backup location, on disk. In this case, a regular, scheduled backup had suddenly ballooned in size due to a large bulk import of data.
That's the essence of baselines. By collecting baseline data for performance and other metrics, we can see trends over time and look out for worrying change in patterns of behavior. We can also map sudden changes to, for example, deployment of new code, or change in hardware configuration and so on.
The phone call from our pleasantly surprised user, with which we started this story, related to the improved performance of a third party ERP application, to which our SQL Server instance provided the back end database services. The vendor allowed only limited changes, but it was possible to extend the functionality of the database, and the developers had done so, over time, adding various objects to the backend. The operations team had previously little input into these change, and over successive updates the database performance had gradually deteriorated. For months, users had complained that various batch functions run by the ERP application took a long time to complete. We needed to start doing things differently.
For a start, we needed to start capturing periodically the values of various key performance metrics, so that we had baseline measurements and could more accurately track patterns of server resource usage and spot spikes or dangerous trends.
With that in place, we planned to collaborate with development on the next deployment and try to make some improvements.
Capturing baseline data for all of required metrics is theoretically simple. We write a query to interrogate the appropriate system view, at regular intervals, and dump the data into a table, for analysis and reporting. Certainly, for example, the full scans/sec PerfMon counter value, one of the metrics we wanted to track, can be captured using a simple query, and Erin Stellato has a series on SQLServerCentral that shows how you can do this for PerfMon data, configuration properties, waits statistics and disk space.
However, collecting, storing, querying and maintaining all the required baseline data does involve considerable administrative overhead. We have to consider questions such as how often to capture each type of metric, how long to retain the baseline data, and then set up jobs to purge the data once it's no longer useful. We may decide to set up jobs to regularly clear out the data in DMVs that store aggregated data, so that we're always comparing baseline data collected over the same time period (such as a day, if we clear the wait stats DMV data nightly, for example)
We also have to develop and maintain the queries to produce useful reports on this data, for example to allow us to compare the values for a set of metrics over a set period of days or weeks or months, so that we can look for trends or sudden changes in behavior.
One of the nice things about Redgate Monitor is that it captures automatically a large number of these useful performance metrics. For example, it captures CPU usage, and this revealed a series of CPU spikes on the production database, one of which is shown in Figure 2.
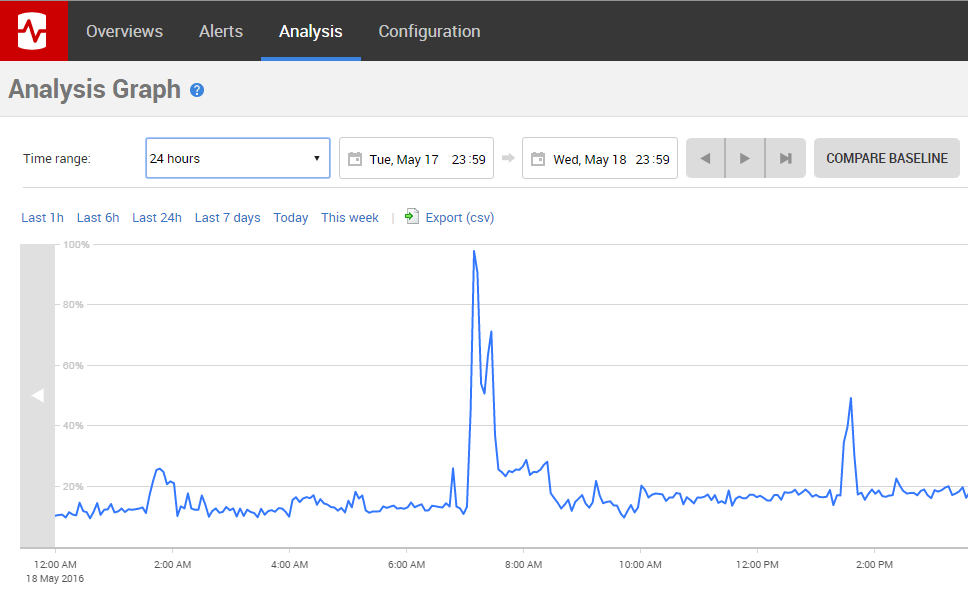
Figure 2 – a spike in CPU usage
When we examined the queries running around this CPU spike, it turned out to be caused by a scheduled job that generated a customer sales report, which made a call to a scalar function called dbo.udfProperCase to proper case customer names. However, this UDF was also called throughout the day, every time a salesperson executed the report on an ad-hoc basis.
To compare this behavior to previous scheduled executions of this report, we used the Compare baseline button to add to the graph a second set of values for the same metric, over the previous 24-hour period, therefore providing a baseline for comparison. We then extended that baseline to include a set number of previous time ranges. So, for example, since we were initially comparing a 24-hour time range, extending the baseline by 7 time ranges added to the graph the same 24-hour range for the previous 7 days.
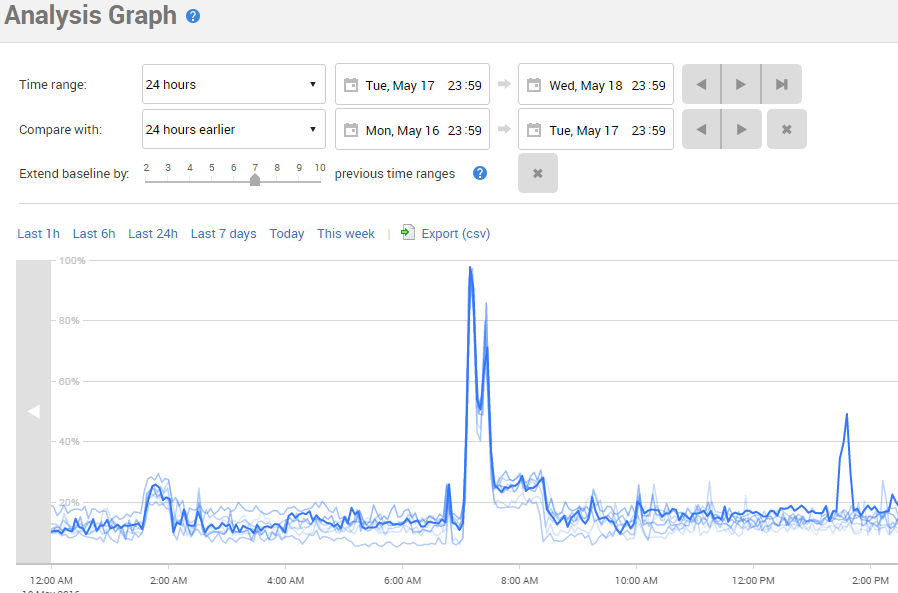
Figure 3 – CPU usage spike, along with a baseline showing expected CPU use
For an even clearer picture, we can display averaged regions, for the baselines, simply by clicking the Regions button at the top of the graph. Redgate Monitor still displays the current data as a line with the rest of the data has been averaged out, with Loess smoothing applied and the area between 1st and 3rd quartiles (the 'mid-range' values) shaded dark blue, and the area between 0th and 1st, and 3rd and 4th (the low- and high-range values) shaded a lighter blue.
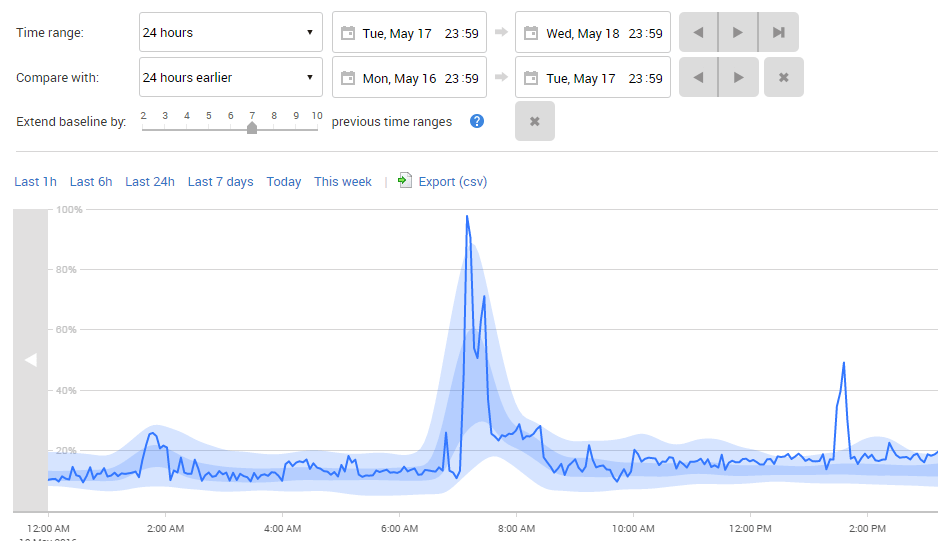
Figure 4 – CPU usage spike with the baseline region
We can see that the CPU spike seen around 7AM is entirely normal, and occurs every time the report runs. It's well known that scalar functions cause lots of performance issues, and it looked like one might be causing trouble here too.
This wasn't the only issue we found. We also saw repeated spikes in the full scans/sec metric.
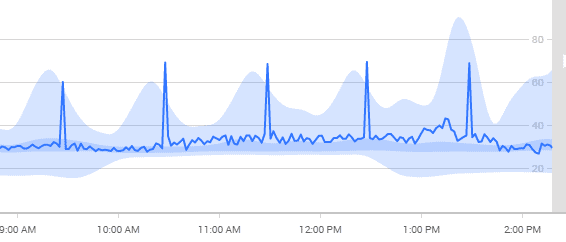
Figure 5 – spikes and baselines for full scans/sec
While examining this data, DBAs were correlating the performance metrics with a number of low priority, long running query alerts. These alerts were set to trigger whenever a query took more than 1 minute to complete. Deeper examination of these queries showed that they often required full table scans of large tables, containing tens of millions of rows, even though the final result set contained only dozens of rows.
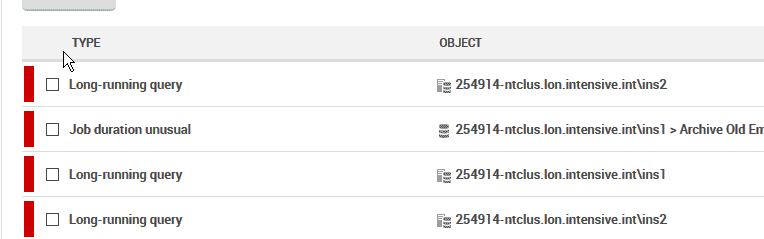
Figure 6 – a series of long-running query alerts
It turned out that many of the queries triggering these alerts used date parameters to limit the data retrieved, but none of the date columns in the tables were indexed.
We proposed to the development team that that the operations team collaborated with them during development of the next round of proposed database changes, and that we trial our first DevOps-style deployment.
Based on what we'd learned from our monitoring and baselines, we proposed removing the UDF used by the sales report. Since only the ERP application needed the function, we suggested they rewrite it in C# and move it into the application. This was an easy change to make, albeit one that impacted lots different classes in the code. However, the initial test results with the new C# function looked promising, showing the sales reports running between 200 and 400% faster than when using the T-SQL UDF function.
Also, in a series of conversations with the vendor's third level support, the Operations DBAs were given permission to add nonclustered indexes to cover the queries that used the date column, provided they could easily be removed from the system in the event of a call to the vendor's support department.
These changes were submitted to the Development group, tested, and deployed alongside the change to remove the proper case UDF and these changes resulted in much better perceived performance from clients, triggering the pleasant phone call that started this story, and demonstrable improvements in the patterns of resource usage on our servers.
After the phone call, and gathering a bit of data, we wrote a report that showed the impact of various sales reports being run on a daily basis. The workload had not changed appreciably from the perspective of clients, but Figure 7 shows the dramatic CPU differences.
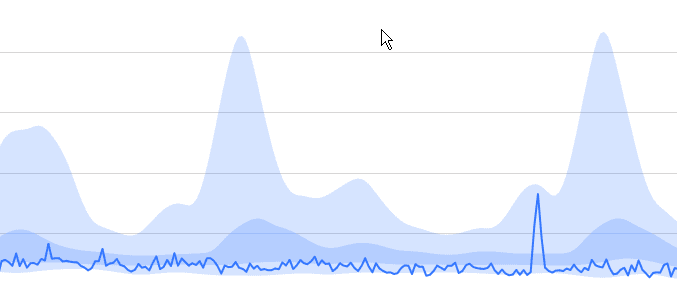
Figure 7 – reduced CPU usage, with baselines
We had also greatly reduced the number of table scans occurring for this database, with our new indexes in place.
With customers happy, and fewer tickets raised for slow performance, the entire DevOps team was pleased with their changes. Already new work is underway, using the same process to ensure that changes are easily deployed, in a timely fashion, with the impact to users measured in two ways. First, the satisfaction of the system, using quotes from actual users are gathered and a random sample of comments read off in joint Development/Operations meetings.
However, in a more scientific and pragmatic sense, the data from Redgate Monitor allows both Developers and Operations staff to measure the impact of changes on the system. General performance metrics as well as custom performance and business counters are captured that objectively analyze changes as helping or hurting performance. No longer are impressions used to determine what is 'normal' or 'slow.'
In addition, reports of the deployments showing performance before and after are distributed to each developer and operations DBA to keep for their semi-annual job reviews. Nothing builds a case for a raise like objective data in a Redgate Monitor report.
Whether you want more details about Redgate Monitor, a demo or information on best practices – get in touch with us.

Redgate has specialized in database software for over 25 years. Our products are used by 92% of the Fortune 100. 200,000 customers rely on Redgate worldwide.

Redgate offers comprehensive documentation and a friendly, helpful support team. An average 87% of customers rate our support 'Excellent'.


