
Memory profiling is useful when looking at how much memory an application is using. The most important use case, however, is when you suspect that the application is leaking memory, and it is important to trace where that leak occurs in the code.
A memory leak happens when a block of memory allocated by an application is not released back to the operating system, even after the object is out of scope and there are no remaining references to it. When this happens, memory utilization keeps increasing, until an OOM (out-of-memory error) occurs, and the operating system kills the application. If the utilization metric is plotted on a graph, it will display a constantly growing trend until the application dies. If the application restarts itself after the OOM, it will exhibit a sawtooth behavior, indicating the repeated increase and sudden drop at OOM. In programming languages where the compiler/interpreter doesn’t manage allocations, a leak can occur if the developer forgets to free allocated memory. It is, however, not uncommon, to see memory leaks in memory-managed languages as well.
Python manages memory allocations itself. Python’s memory manager is responsible for all allocations and deallocations on the private heap. By default, Python uses reference counting to keep track of freeable objects. The optional garbage collector provides supplemental mechanisms to detect unreachable objects, otherwise not reclaimed due to cyclic referencing.
Several tools are available for profiling memory in Python. This article covers “tracemalloc” which is part of the standard library. Getting started is very easy because no special installation is needed. One can start profiling and viewing the statistics straight out of the box. Tracemalloc provides statistics about objects allocated by Python on the heap. It does not account for any allocations done by underlying C libraries.
The profiler works by letting you take a snapshot of memory during runtime. There are several convenient APIs to then display the statistics contained in that snapshot, grouped by filename or lineno. It is also possible to compare two snapshots, which helps identify how memory use changes over the course of program execution. Finally, there are methods to display the traceback to where a block of memory is allocated in the code.
I will go through an example that simulates constant growing memory (similar to a leak) and how to use the tracemalloc module to display statistics and eventually trace the line of code introducing that leak.
Tracing a memory leak
Here is a one-liner function called mem_leaker() that will be used to simulate the memory leak. It grows a global array by ten thousand elements every time it is invoked.
|
1 2 3 4 |
arr = [] def mem_leaker(): '''Appends to a global array in order to simulate a memory leak.''' arr.append(np.ones(10000, dtype=np.int64)) |
I wrapped this function inside a script named memleak.py with some driver code. The first thing to do is to call tracemalloc.start() as early as possible in order to start profiling. The default frame count is 1. This value defines the depth of a trace python will capture. The value can be overridden by setting PYTHONTRACEMALLOC environment variable to a desired number. In this example, I am passing a value of “10” to set the count to ten at runtime.
The tiny for loop iterates five times, invoking the make-shift memory leaker each time. The call to gc.collect() just nudges Python’s garbage collector to release any unreachable memory blocks to filter out noise. Although, you can be sure this program does not create any cyclic references.
Listing: memleak.py
|
1 2 3 4 5 6 7 8 9 10 11 12 13 14 15 16 17 18 19 20 21 22 23 24 |
import gc import tracemalloc import numpy as np import profiler arr = [] def mem_leaker(): '''Appends to a global array in order to simulate a memory leak.''' arr.append(np.ones(10000, dtype=np.int64)) if __name__ == '__main__': tracemalloc.start(10) for _ in range(5): mem_leaker() gc.collect() profiler.snapshot() profiler.display_stats() profiler.compare() profiler.print_trace() |
All the profiling code is written inside a separate script called profiler.py.
Listing: profiler.py
|
1 2 3 4 5 6 7 8 9 10 11 12 13 14 15 16 17 18 19 20 21 22 23 24 25 26 27 28 29 30 31 32 33 34 35 36 37 |
import tracemalloc # list to store memory snapshots snaps = [] def snapshot(): snaps.append(tracemalloc.take_snapshot()) def display_stats(): stats = snaps[0].statistics('filename') print("\n*** top 5 stats grouped by filename ***") for s in stats[:5]: print(s) def compare(): first = snaps[0] for snapshot in snaps[1:]: stats = snapshot.compare_to(first, 'lineno') print("\n*** top 10 stats ***") for s in stats[:10]: print(s) def print_trace(): # pick the last saved snapshot, filter noise snapshot = snaps[-1].filter_traces(( tracemalloc.Filter(False, "<frozen importlib._bootstrap>"), tracemalloc.Filter(False, "<frozen importlib._bootstrap_external>"), tracemalloc.Filter(False, "<unknown>"), )) largest = snapshot.statistics("traceback")[0] print(f"\n*** Trace for largest memory block - ({largest.count} blocks, {largest.size/1024} Kb) ***") for l in largest.traceback.format(): print(l) |
Going back to the for loop in the driver code, after mem_leaker() is invoked, profiler.snapshot(), which is just a wrapper around tracemalloc.take_snapshot(), will take a snapshot and store it in a list. The length of the list will be five at the end of the loop.
Once you have the snapshots, you can see how much memory was allocated. It can be useful to begin with per file grouping if the application is big, and you have no idea where the leak is happening. For demonstration, take a closer look at profiler.display_stats(); it displays the first five grouped items from the first snapshot.
|
1 2 3 4 5 |
def display_stats(): stats = snaps[0].statistics('filename') print("\n*** top 5 stats grouped by filename ***") for s in stats[:5]: print(s) |
The output looks like this.
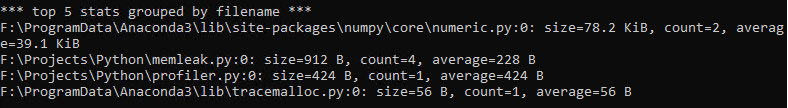
At the top of the list, numpy’s numeric.py allocated 78.2 Kb of memory. The tracemalloc module itself will also use some memory for profiling. That should be ignored during observation.
Comparing snapshots and observing trends
Now, in order to debug further, The code compared the first snapshot with each subsequent snapshot to see the top ten differences using compare().
|
1 2 3 4 5 6 7 |
def compare(): first = snaps[0] for snapshot in snaps[1:]: stats = snapshot.compare_to(first, 'lineno') print("\n*** top 10 stats ***") for s in stats[:10]: print(s) |
The complete output of compare() looks like this.
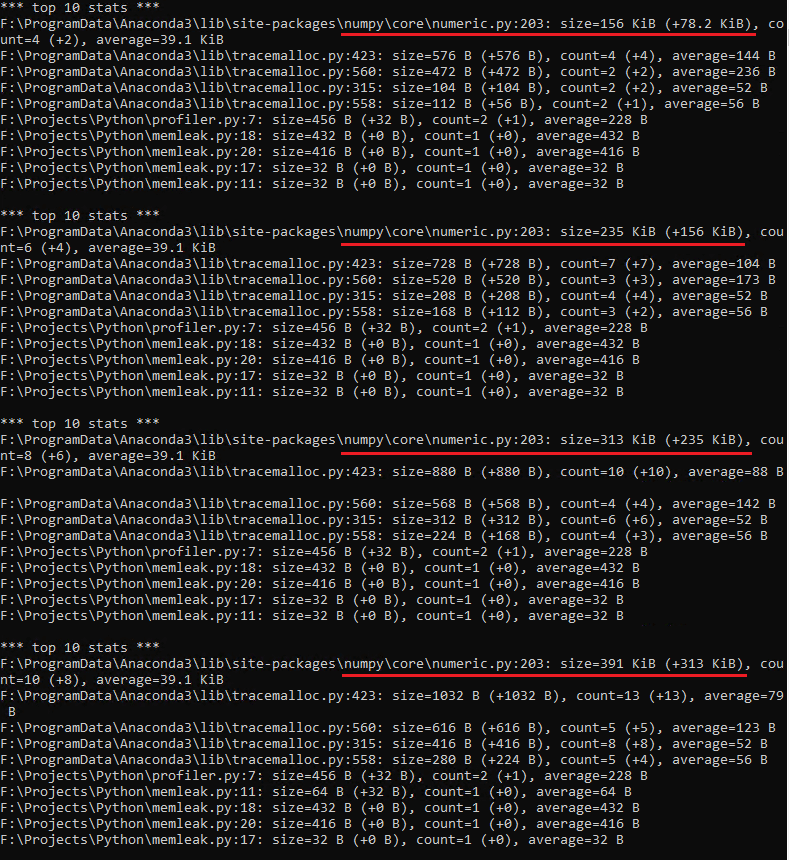
Since there were five total snapshots, there are four sets of statistics from the comparisons. Some important observations here:
- numpy/core/numeric.py at line 204, is at the top in each set, allocating the most memory.
- Now, note the change in memory usage by numeric.py as I go over each of the result sets.
In the first set, the total memory used by numeric.py is 156 Kb, an increase of 78 Kb from the first snapshot.
In the second set, total memory used by numeric.py jumps to 235 Kb, a total increase of 156 Kb from the first snapshot. Doing a little math, this also means there was an increase of ~79 Kb since the last snapshot.
In the third set, total memory used by numeric.py jumps to 313 Kb, a total increase of 235 Kb from the first snapshot. This also means there was again an increase of ~78 Kb since the last snapshot.
In the fourth set, total memory used by numeric.py jumps to 391 Kb, a total increase of 313 Kb from the first snapshot. This also means there was, once again, an increase of ~78 Kb since the last snapshot.
- A clear cumulative trend can be seen here in the allocation done by numeric.py. At each iteration, ignoring rounding differences, ~78 Kb more memory was allocated. If you look at
mem_leaker()again, it appends ten thousand elements to the array, each of size 8 bytes, which brings the total to 80000 bytes, or 78.125 Kb. This matches the observed increase from the snapshot deltas. - It is constantly growing trends like this that eventually lead to a code problem if the growth pattern is unexpected.
See a traceback
The last thing in the example was to print the traceback for the largest memory block for more granularity. In this case, the largest block is one from numeric.py. The filter_traces() method is very helpful in eliminating noise when debugging long traces.
|
1 2 3 4 5 6 7 8 9 10 11 12 |
def print_trace(): # pick the last saved snapshot, filter noise snapshot = snaps[-1].filter_traces(( tracemalloc.Filter(False, "<frozen importlib._bootstrap>"), tracemalloc.Filter(False, "<frozen importlib._bootstrap_external>"), tracemalloc.Filter(False, "<unknown>"), )) largest = snapshot.statistics("traceback")[0] print(f"\n*** Trace for largest memory block - ({largest.count} blocks, {largest.size/1024} Kb) ***") for l in largest.traceback.format(): print(l) |
The trace looks like this.
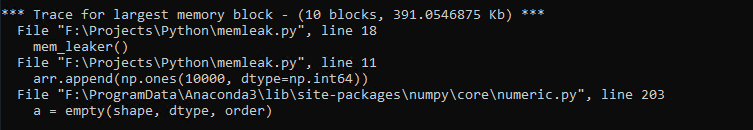
This trace leads from the application code to the line in the numpy library, where the allocation actually takes place. You can look at the source code here – https://github.com/numpy/numpy/blob/main/numpy/core/numeric.py#L204.
Conclusion
Here, you saw a simple demonstration of using Python stdlib’s tracemalloc module to observe various memory related statistics, compared snapshots to see the allocation deltas and used all this information to trace back to the code using a substantial amount of memory. In large applications, it may take some time to narrow down scope and find the line of code introducing a leak. The tracemalloc module provides all the necessary APIs to do so, and it just works out of the box.
References
https://docs.python.org/3/library/tracemalloc.html
This document contains proprietary information and is protected by copyright law.
Copyright © 2026 Red Gate Software Limited. All rights reserved
Load comments