
OK, pretty much any DBA worth their salt has read Brent Ozar’s (Blog | Twitter) blog about getting a baseline of your server’s performance counters and then getting the same counters at regular intervals afterwards so that you can track performance trends and evidence how you are making your servers faster or cope with extra load without costing your boss any money for hardware upgrades. No? well, go read it now. I can wait a while as there is a great video there too…http://www.brentozar.com/archive/2006/12/dba-101-using-perfmon-for-sql-performance-tuning/, it’s part of Brent’s great series of blog articles on performance tuning which are all accessed from http://www.brentozar.com/go/faster. Anyway, just to recap, Brent explains hot to get the Perfmon counters by going through the Perfmon UI and selecting each counter one by one, for each server/instance you want to baseline. Without being to delicate about this process, its a proper PITA, the UI isn’t great and the way it collects data as you go is poor.
This is where a utility called Typeperf comes into it’s own. It’s a command line utility that you can get to run your Perfmon counter collection activities in an almost hands-off way. Open a command prompt window and type Typeperf /? to get its help as:
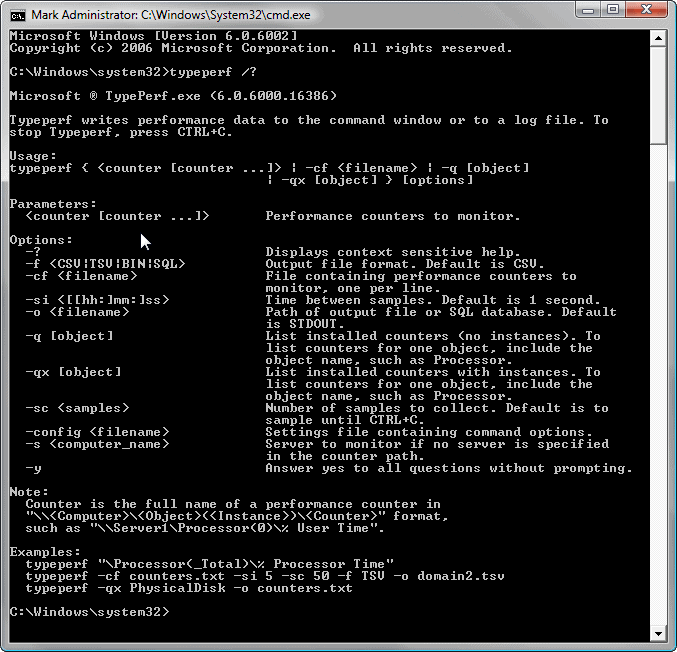
Now, to me the most important one of these parameters is the -cf one. It means that you can edit the counter names in a text file for the data you want collected. Much easier to check over and much easier to become portable between different servers. Ctrl + H to search and replace values in a text file is a lot easier than going through the Perfmon UI over and over.
Brent recommends certain counters in his blog:
- Memory – Available MBytes
- Paging File – % Usage
- Physical Disk – % Disk Time
- Physical Disk – Avg. Disk Queue Length
- Physical Disk – Avg. Disk sec/Read
- Physical Disk – Avg. Disk sec/Write
- Physical Disk – Disk Reads/sec
- Physical Disk – Disk Writes/sec
- Processor – % Processor Time
- SQLServer:Buffer Manager – Buffer cache hit ratio
- SQLServer:Buffer Manager – Page life expectancy
- SQLServer:General Statistics – User Connections
- SQLServer:Memory Manager – Memory Grants Pending
- System – Processor Queue Length
Pretty comprehensive and very useful, but it grows a lot if you have more than one hard drive to monitor (add 6 counters for each additional physical disk) and 1 more counter for each CPU core, you may also choose to collect multiple instance counters (not actually mentioned by Brent) so that would be 4 more counters per instance. I have some servers with 3 disks and 4 cores so the list above grows to somewhere close to 30 counter definitions.
It isn’t mentioned in the supporting content that I have seen but the Typeperf utility accepts wildcards in the config file so to collect data on 3 disks, where you might have to have used;
|
1 2 3 4 5 6 7 8 9 10 11 12 13 14 15 16 17 |
\\~ServerName~PhysicalDisk(0 C:)\Avg. Disk Queue Length \\~ServerName~PhysicalDisk(0 C:)\Avg. Disk sec/Read \\~ServerName~PhysicalDisk(0 C:)\Avg. Disk sec/Write \\~ServerName~PhysicalDisk(0 C:)\Disk Reads/sec \\~ServerName~PhysicalDisk(0 C:)\Disk Writes/sec \\~ServerName~PhysicalDisk(1 E:)\% Disk Time \\~ServerName~PhysicalDisk(1 E:)\Avg. Disk Queue Length \\~ServerName~PhysicalDisk(1 E:)\Avg. Disk sec/Read \\~ServerName~PhysicalDisk(1 E:)\Avg. Disk sec/Write \\~ServerName~PhysicalDisk(1 E:)\Disk Reads/sec \\~ServerName~PhysicalDisk(1 E:)\Disk Writes/sec \\~ServerName~PhysicalDisk(1 F:)\% Disk Time \\~ServerName~PhysicalDisk(1 F:)\Avg. Disk Queue Length \\~ServerName~PhysicalDisk(1 F:)\Avg. Disk sec/Read \\~ServerName~PhysicalDisk(1 F:)\Avg. Disk sec/Write \\~ServerName~PhysicalDisk(1 F:)\Disk Reads/sec \\~ServerName~PhysicalDisk(1 F:)\Disk Writes/sec |
You can simply use:
|
1 2 3 4 5 6 |
\\~ServerName~PhysicalDisk(* *)\% Disk Time \\~ServerName~PhysicalDisk(* *)\Avg. Disk Queue Length \\~ServerName~PhysicalDisk(* *)\Avg. Disk sec/Read \\~ServerName~PhysicalDisk(* *)\Avg. Disk sec/Write \\~ServerName~PhysicalDisk(* *)\Disk Reads/sec \\~ServerName~PhysicalDisk(* *)\Disk Writes/sec |
The same goes for Processors, use this: \\~ServerName~Processor(*)\% Processor Time
Ok, to use Typeperf with this file you need a command like: Typeperf -cf “C:\configfilelocationonyourserver.txt” -o “C:\locationwhereoutputshouldgo.csv” -si 15 -sc 480 This will use the text file as its guide on what counters to collect and the csv file as the chosen target of all the collected values. Using -si and a value will control how often the samples are taken and -sc will control how many samples are taken. We are taking 480 samples, 15 seconds apart so we will get data over a period of 2 hours.
To collect all of the counters mentioned in Brent’s blog, use
|
1 2 3 4 5 6 7 8 9 10 11 12 13 14 |
\\~ServerName~\MemoryAvailable MBytes \\~ServerName~\Paging File(_Total)% Usage \\~ServerName~\PhysicalDisk(* *)\% Disk Time \\~ServerName~\PhysicalDisk(* *)\Avg. Disk Queue Length \\~ServerName~\PhysicalDisk(* *)\Avg. Disk sec/Read \\~ServerName~\PhysicalDisk(* *)\Avg. Disk sec/Write \\~ServerName~\PhysicalDisk(* *)\Disk Reads/sec \\~ServerName~\PhysicalDisk(* *)\Disk Writes/sec \\~ServerName~\Processor(*)\% Processor Time \\~ServerName~\MSSQL$~InstanceName~:Buffer ManagerBuffer cache hit ratio \\~ServerName~\MSSQL$~InstanceName~:Buffer ManagerPage life expectancy \\~ServerName~\MSSQL$~InstanceName~:General StatisticsUser Connections \\~ServerName~\MSSQL$~InstanceName~:Memory ManagerMemory Grants Pending \\~ServerName~\SystemProcessor Queue Length |
Replace the ~ServerName~ and ~InstanceName~ with values of the servers that you want to collect stats for, save that file onto your monitoring server and reference it as above and hey presto, your data will be collected. Much easier if you are starting collection of stats on new servers or having to bring new instances into your stats collection routines. Let me know how you get on with this method of speeding up your stats collection.
Note: In transferring to WordPress the back slash characters in the lines above have been stripped out. If you get any syntax errors then you will have found one of the places that I missed when I have done the corrections – sorry about that.
Load comments