
There’s a nasty memory leak which the .NET Framework can suffer from when using certain classes.
Let’s say you instantiate a new XmlSerializer(Type). Behind the scenes, the framework will dynamically generate an assembly to serialize or deserialize this Type. The Framework does some cleverness which means this assembly will be reused next time you instantiate another XmlSerializer(Type). Great.
Sort of. The problem is that XmlSerializer has 10 possible constructors, and only 2 of those get cached. If you use, say, new XmlSerializer(Type, Type[]), the dynamically generated assemblies don’t get reused, so the Framework has to dynamically generate an assembly for each instantiation. It’s worse than that too, because these assemblies (which use memory in the CLR) can’t be unloaded without killing the process, which means that memory usage gradually increases over time until the process is restarted or dies with an OutOfMemoryException.
The MSDN documentation for this class describes this limitation (about half way down the page), and your options for working around it: either use one of the constructors which cache the assembly properly (thanks for that nugget of wisdom…), or cache them yourself in a Hashtable.
Any type of .NET application using this class can be affected, but it’s most commonly found in ASP.NET sites, because you can end up in a situation where every page request causes a new assembly to be generated. This sort of issue often won’t show up under the light load found in a development environment because the amount of memory used by each assembly is pretty small, but once the application goes live in production, it will quickly start growing memory usage. I’ve seen sites which need to be restarted every few hours because of exactly this issue, dropping all the users currently connected.
It isn’t just the XmlSerializer class, either. A similar effect can occur if you misuse regexes, and with the XslCompiledTransform class (I think that one only happens if you build as debug) but the XmlSerializer issue seems to be the one people run into most commonly.
There are two reasons this is a particularly painful type of memory leak. Firstly, it often doesn’t show up until the application is under a reasonable amount of load, but when it does, it’ll take out the whole application and ruin your release day. Secondly, it’s really hard to spot unless you’re actively looking for it, and even then it’s pretty tricky to understand the cause. Tess Ferrandez has a great blog post on using windbg to try to investigate this issue so I’m not going to dive into that approach here, but it’s not for the faint of heart and you’ll need to know that you’re looking for this in the first place (spoiler alert: it involves equal measures of advanced windbg fu, patience, and luck).
We’ve just finished doing some work in ANTS Memory Profiler to help with this problem, because the memory profiler is where a lot of people go to try understanding growing memory usage. The goal was to make this issue easy to spot and understand, without needing to specifically look for it and without assuming advance knowledge that it can be a problem.
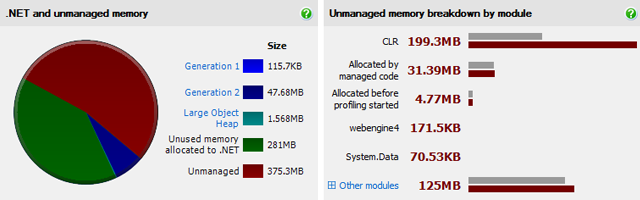
In version 8.1, you could see how much of your application’s memory was unmanaged (in the left-hand pie chart), and using the module breakdown you could see that this was due to an increase in size for the CLR itself, but this didn’t get you much closer to the cause of a problem.
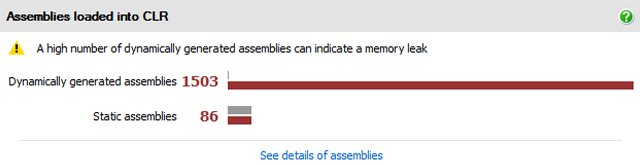
In 8.2, we’ve introduced a new panel in the summary screen showing the number of static and dynamically generated assemblies which are loaded into the CLR. If this contains a lot of similar dynamically generated assemblies, you’ll get a warning too.
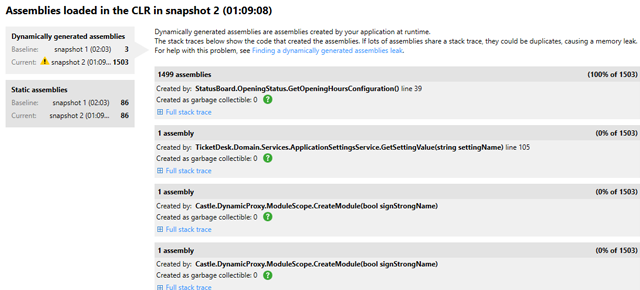
You can see a list of these assemblies grouped by the stack trace of the point at which they were created. In the example above, the GetOpeningHoursConfiguration() method seems to be guilty.
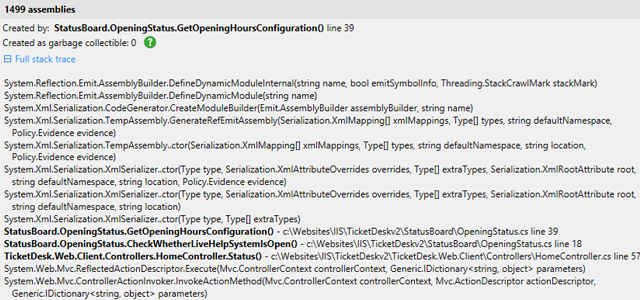
We can look at a more detailed stack trace to pin down exactly what is happening, then go to our code and fix the issue.
Have you run into this issue in the past? We’d love to hear about how you tracked it down.
This document contains proprietary information and is protected by copyright law.
Copyright © 2026 Red Gate Software Limited. All rights reserved
Load comments