Security and compliance
Ensure data security and compliance with data masking, monitoring, and change traceability
Ensure data security and compliance with data masking, monitoring, and change traceability
Monitor and understand your databases with full visibility into performance and change
Build, test, and deploy database changes with confidence
Simplify and speed up database development workflows
Prepare reliable data foundations for AI initiatives
Simplify and secure database modernization across platforms
Control costs and boost efficiency in database operations
Simplify and speed up cloud database transformation
Try it now, choose your version later.
View performance data for both your .NET code and database requests made by the .NET code.
Profile database requests your application makes to any SQL Server, Oracle, MySQL (or MariaDB), and PostgreSQL database.
This is ideal if you're using an ORM.
Read more about our database profiling support, on Simple-talkView rich data about outbound HTTP requests made by your application, including request and response header information.
See all the information in the context of the .NET code which caused the request to run.
Get comprehensive performance information on your application's disk activity.
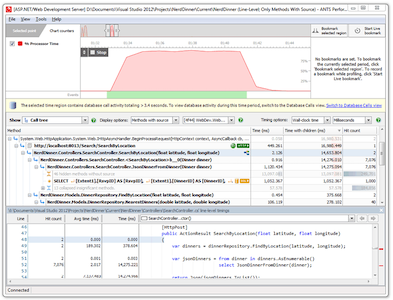
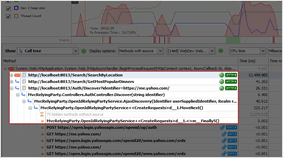
The call tree in the .NET performance profiler shows you data for every method and identifies the most expensive methods, database queries, and web requests.
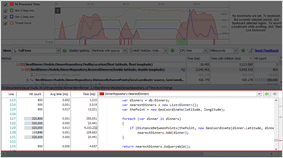
Profile C# or any other .NET code line by line, with precise timing data so you can find issues at a glance. Expensive lines of code are automatically highlighted for quick visual inspection.
Understand how your .NET code makes database queries and how those queries perform. ANTS Performance Profiler supports SQL Server and Oracle databases, whether local or remote.
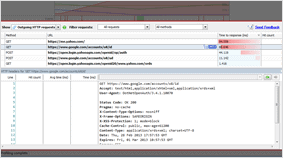
Look at your application's outgoing HTTP requests. Get data about the request and response headers, and see what .NET code caused them to run.
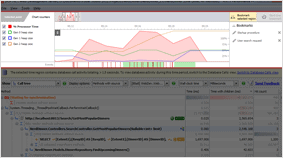
Use the interactive timeline to check the CPU usage of your .NET or ASP.NET application and highlight problem areas to focus only on the data that matters.
Code and database activity are grouped by HTTP request, exposing performance problems on specific web pages.
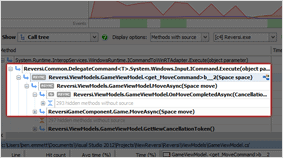
Understand the performance of C#5 async code. View activity in the context of the code you wrote, and see how work being done asynchronously is related to the async method which caused it to run.
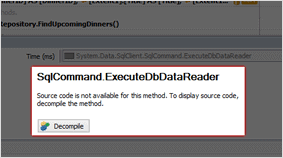
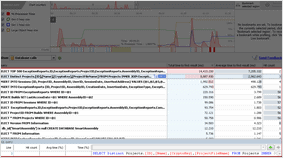
Find bottlenecks in third-party components and framework assemblies using integrated decompilation, powered by .NET Reflector.
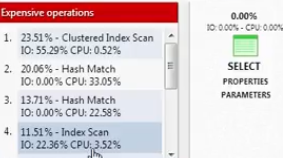
Relate timings for your individual lines of .NET code right through to the SQL execution plans. Find out exactly why your SQL query is running slow.
| .NET Code Profiling | Standard | Pro | Bundle |
|---|---|---|---|
| Profile .NET executables, ASP.NET web applications, Windows services, Silverlight, SharePoint, Windows Store apps, and COM+ server applications – including multi-threaded applications | |||
| Line-level timings (instrumented profiling mode) | |||
| Sampling mode, for minimal-overhead profiling | |||
| Attach to a running process | |||
| Timeline: get real-time feedback on your application's performance and select interesting regions to focus your profiling results on | |||
| Call Tree: auto-expands to highlight the worst performing stack traces | |||
| Save and export profiler results | |||
| Profile C#5 async code | |||
| Call graph view: visualize all callers and callees for a selected method | |||
| Integrated decompilation: get source code and timings for third-party and framework methods | – | ||
| Command-line access | – | ||
| Profile child processes | – | ||
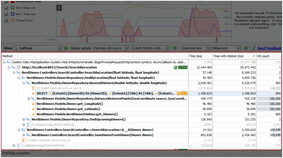
| View SQL query strings, timings, and hit counts in the call tree | – | ||
| Profile calls to all SQL Server versions, including Express and Compact | – | ||
| Profile calls to Oracle databases | – | ||
| Profile calls to MySQL (or MariaDB) | – | ||
| Profile calls to PostgreSQL | – | ||
| Profile calls to databases hosted in the cloud (Amazon RDS and SQL Azure) | – | ||
| Understand what .NET code led to queries being executed | – | ||
| Dedicated file I/O view: see what files have been accessed | – | ||
| See disk read / write speeds for individual files | – | ||
| View timing data and hit counts for inbound HTTP calls to any ASP.NET application | – | ||
| See methods in your ASP.NET app grouped by the HTTP requests that triggered them | – | ||
| Investigate performance problems related to specific web pages | – | ||
| ANTS Memory Profiler: find memory leaks and understand how your application uses memory | – | – | |
| .NET Reflector VSPro: debug third-party code in Visual Studio | – | – |
If you have any questions about which edition is right for you, feel free to email us at sales@red-gate.com
* * The Standard edition can only profile methods with source code (i.e. it will not profile Microsoft framework methods or third-party components). It uses PDB files to find out if you have the source code, so you will need the PDB files to see your performance data.
Although we don't offer a floating license, Redgate's licensing model includes volume discounts. These are often more cost-effective than a typical floating license model, and they let all your users work with their tools at the same time, without waiting for a license to become free.
In the odd case that the volume discount scheme doesn't make life easier for you, we'll happily review your circumstances and work with you to find a better solution.
We offer a 50% discount for a single personal license for personal use, hobbyist use, and home use. This license is not available to companies.
We offer a range of free licenses for use on your open source projects. Find out more.
We've helped lots of organizations in these categories over the years, so we're very happy to discuss circumstances around our licensing. Please get in touch directly to see how we can help.
We're happy to provide free non-commercial use licenses for individual students in education, upon verification. Please contact us to apply for a license of this kind and to get more information.


