Machine learning has been reshaping our lives for quite a while now. Be it the smallest thing such as unlocking your phone through Face Recognition to useful interactions with Siri, Alexa, Cortana, or Google using Speech Recognition, machine learning is everywhere! In this article, I am going to provide a brief overview of machine learning and data science. With a basic understanding of these concepts, you can dive deeper into the details of linear regression and how you can build a machine learning model that will help you to solve many practical problems. The article will focus on building a Linear Regression model for Movie Budget data using various modules in Python. It will make use of prebuilt data science modules such as Pandas, Matplotlib and Scikit-learn to build an efficient model. First, I’ll start with a brief introduction about different terms in the data science and machine learning space, then move the focus to Python coding so that you can actually start building your own machine learning model.
Machine Learning
As the name indicates, making machines learn what humans can do is machine learning. It’s all about making computers and applications learn and become decisive without explicitly programming all the possibilities. Based on known data or various possibilities with correct answers provided to the algorithms, the computer should yield the solutions to a given problem when the answer is not known.
In my previous article, I gave a granular view of components involved in machine learning which might help you to get a conceptual understanding of how Data, Model and Algorithms are interconnected.
Data Science
At its heart, data science is about turning the data into value. Data science can be thought of as the application for finding certain patterns in data and through that pattern deduce the outcome for the future problem at hand. It’s a combination of data mining and computer science. Initially, data mining was done using statistics, but with the help of data science, it’s mainly done programmatically. The powerful programming languages such as Python and R provide support to various scientific computing packages that leverage building statistics-focused models to predict the solutions.
As the name suggests, data science is all about data. There are various steps involved from collecting the data to processing and analysing the data. At each step, the different actors/roles come into play as shown in the table below:
|
Steps Involved |
Different Processes at each step |
Roles |
|
Collect Data |
Data or content from various sources |
Data Analyst |
|
Move/Store Data |
Structured and Unstructured Data Storage |
Data Analyst |
|
Clean/Explore/ Transform Data |
Cleaning and ETL |
Data Scientist |
|
Aggregate/Label Data |
Analytics, training and aggregate data |
Data Scientist |
|
Learn/Optimize Data |
ML Algorithms, AI and A/B Testing |
Machine Learning expert |
Many data professionals, including DBAs and ETL developers, are familiar with most of these steps as well!
Linear Regression
Linear regression is the core concept in data science. It is a statistical term and mainly used whenever there is a need to make a prediction, model a phenomenon or discover the relationships between things. It is used for finding the relationship between two continuous variables. One of them is an independent variable, and the other is a dependent variable. Linear regression is used for determining the hypothesis. The core idea is to find the relationship between the two variables and obtaining a line that best fits the data. The best line is the one for which the most predictions are close to correct, which means the chances of errors are very low.
Here’s an example to help you understand linear regression. Assume that you are given the data for all the past movie productions: the movie budget and the revenue that they collected through the box office or any other sources. Now, imagine that you want to produce a movie and you want to predict from previous movie successes how much money your movie will make.
Given the data about various successful high budget films such as Avatar, Avengers, Titanic, etc., you can perform a hypothesis and try to understand where your movie fits. You are essentially going to build the best line (green line in the image below) that will help you predict how much revenue the movie can make given the budget of the film.
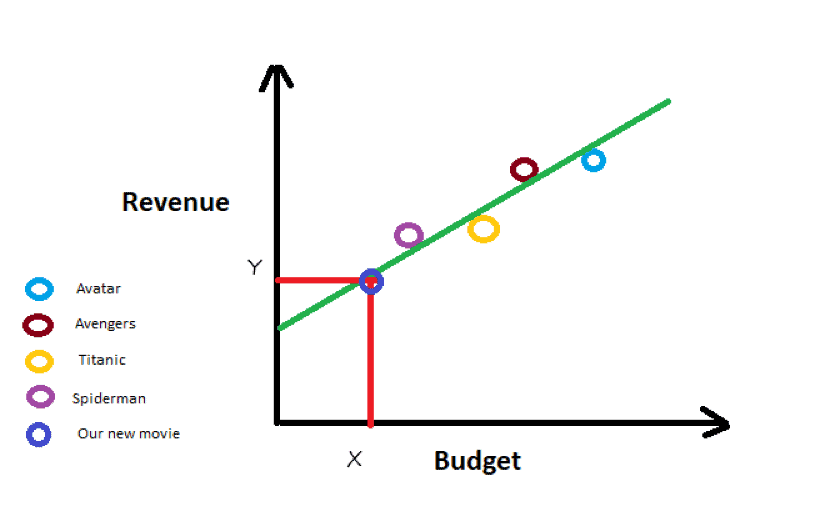
Through the budget value (X) for the movie, you can predict how much revenue (Y) the movie is going to make by just making a line from budget onto the best line (green line).
Requirements
Many languages such as Python, R, and Scala, etc., provide support for data science by bringing together statistics, data analysis and their related strategies to understand and analyse the data. This article will show how to use Python to analyse the data. Python has long been known as an easy to learn programming language from a syntax point of view. It provides extensive support to statistical and data science related libraries such as NumPy, SciPy, Scikit-learn, and Keras, etc. It also has an active community with a vast selection of libraries and resources which makes Python as the first choice for many data scientists.
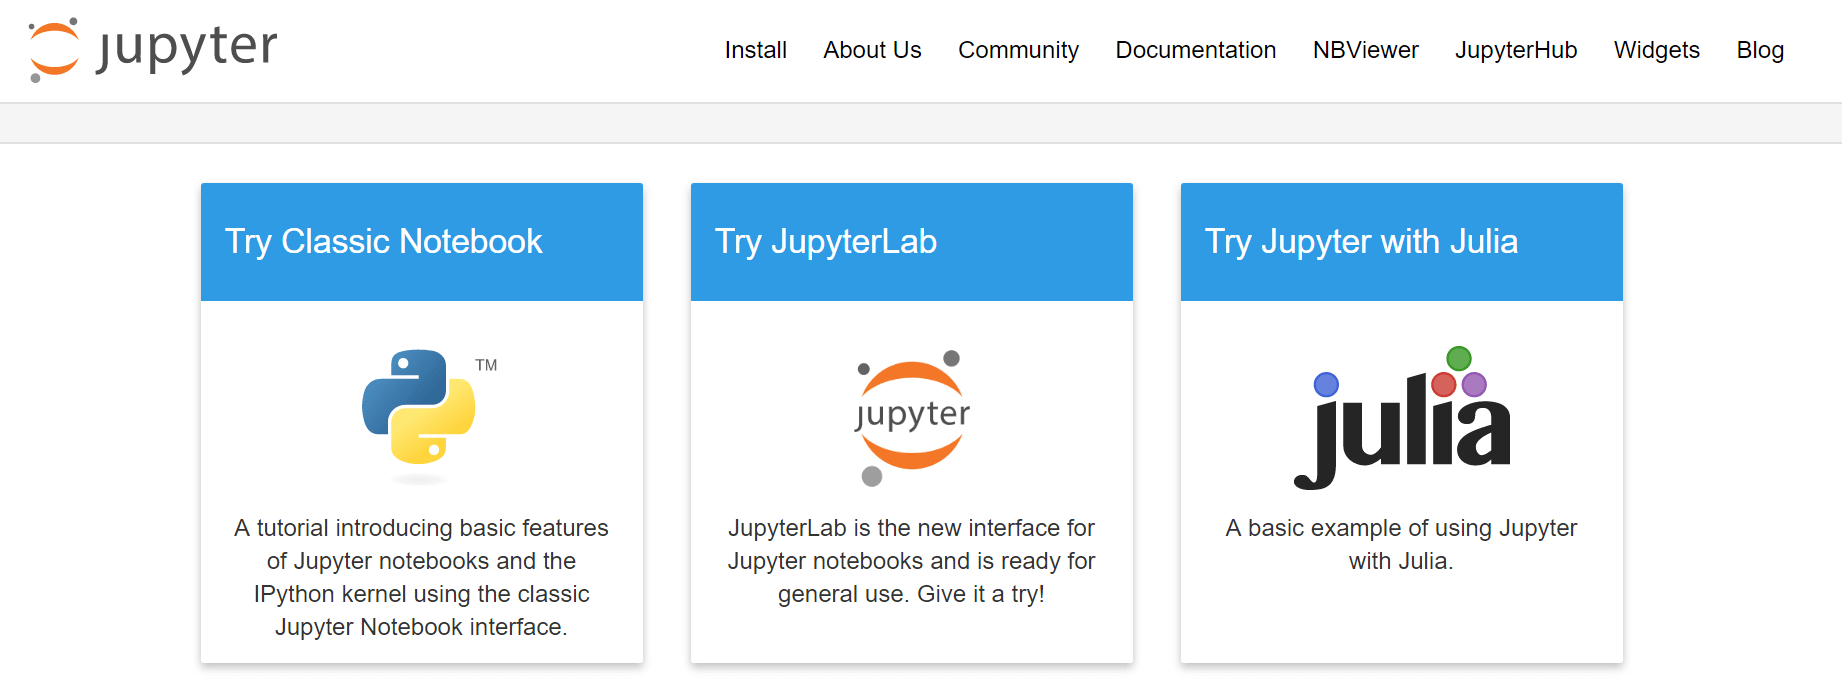
Jupyter Notebook is an incredible tool that provides an easy way to execute the Python code. This article will use the browser version of Jupyter Python Notebooks. Click on Try Classic Notebook after you go to this link.
Editor’s note: you can also use the Jupyter Notebook feature found in Azure Machine Learning Studio, Azure Data Studio, or Azure Machine Learning Services.
This will open a new Python notebook in the browser where you can write Python commands and see the results.
Note: The browser version of Jupyter Notebook sometimes gets disconnected if it is kept idle for a long time. You may try downloading Anaconda and after installation is complete open the Jupyter notebook. This will help you run the Jupyter notebook on the local computer without connectivity issues.
Before writing some interesting Python commands and cooking something, you need to gather and clean the ingredients for the recipe.
Start building the model
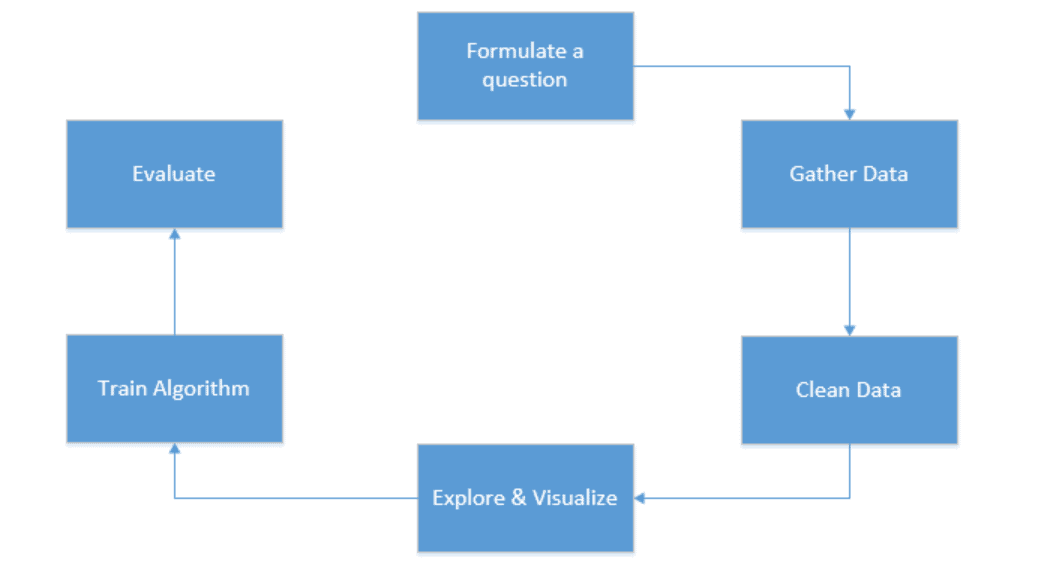
To create a successful machine learning model, you need to follow some steps:
- Formulate the question
- Gather and clean the data
- Visualise the data
- Train the algorithm
- Evaluate the result based on the requirements.
To solve the problem, you are going to follow these steps:
Formulate a question
The question is the same example you saw before given the movie budget and revenue. The question is “How much money/revenue is the movie going to make?”
Gather data
To perform the analysis on the data, you need the movie budget in USD and movie revenue in USD. You can use this website to gather the data. All you have to do is download the data and open it in Excel for your research. (To make it easier, you can download the data from here as well.)
Clean the data
The next step is cleaning the wrong data. You might have noticed that the data in the Excel sheet contains a $0 amount in some cases.
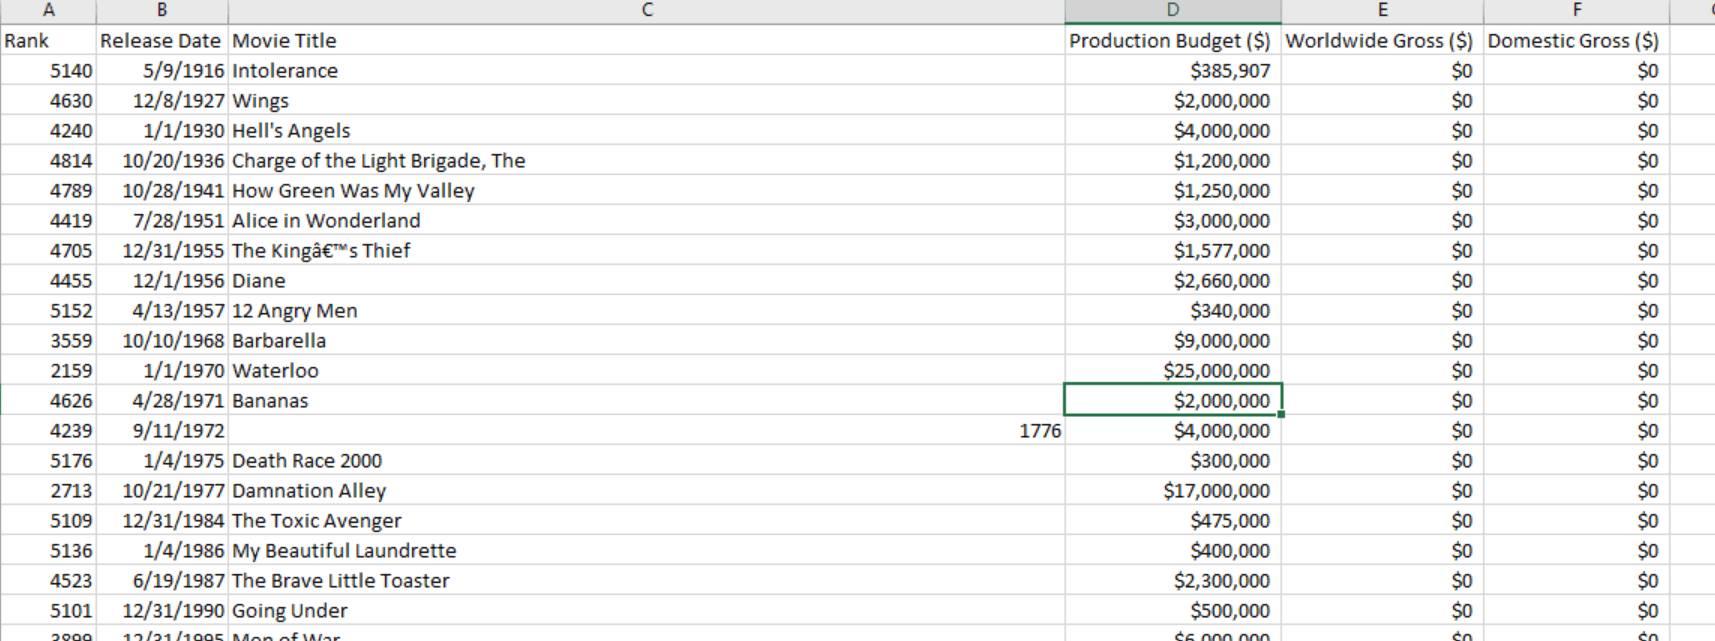
The reason for this might be because the movie dates are in the future or the movie never came out. There might be many more reasons to have a $0 amount there, so for now, delete these $0 rows so that they don’t cause any false failures in the analysis and focus on the ones which have concrete results.
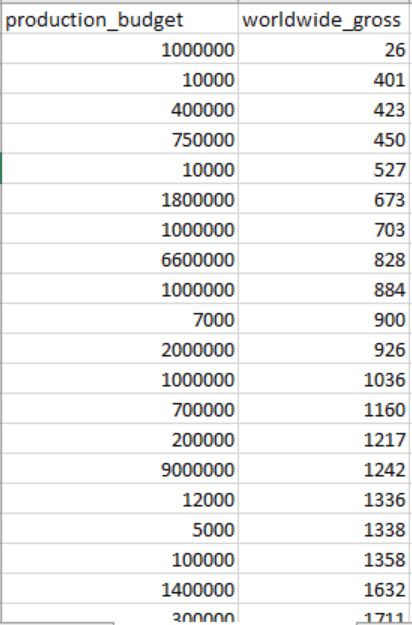
As discussed before, the focus will be just on the two columns production budget and worldwide gross because these are the columns that you will plot on the graph. After cleaning the data, removing the $ signs and renaming column names, this is how my Movie_Revenue_Edited looks:
Explore and Visualize
Now it’s time to visualise how the production budget and worldwide gross are related to each other. To do so, import the .csv file now so that you can do some magic on it. For this, click on the Jupyter logo, and it will take you to a screen. Click on Upload to upload the Movie_Revenue_Edited.csv file.
The next step is to start with a fresh notebook. In the Jupyter notebook, go to the File Menu-> New Notebook -> Python 3. This will open a new instance of Python notebook for you. I have renamed my notebook to My Movie Prediction. (You can also download the completed Movie Linear Regression Notebook.)
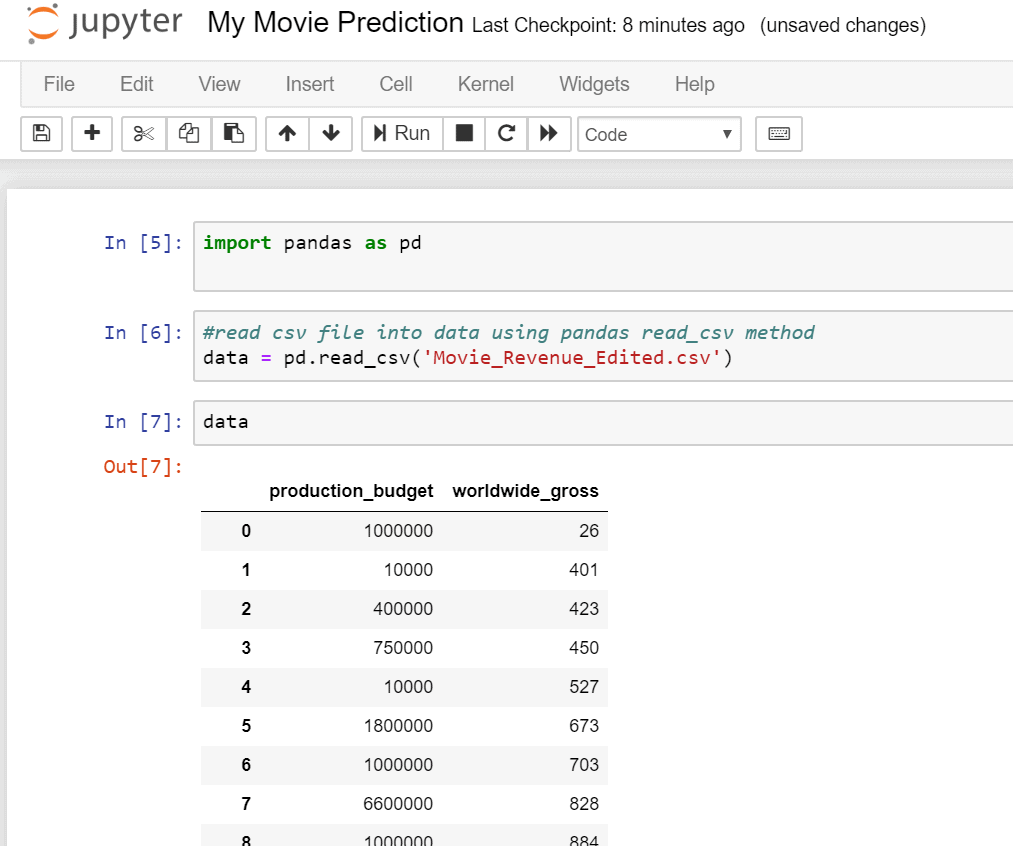
Now to access the csv file into the notebook, you need to use the Pandas module. Pandas is a prebuilt data science library that lets you do fast data analysis as well as data cleaning. It is built on the top of a famous data science library called NumPy. Pandas work with wide variety of data sources such as Excel, CSV, SQL file. In each cell, you can write either markup or code. You can select a cell with code and run it to get the results right in the notebook.
Here’s an example of importing the file and displaying the data (be sure to enter the code into the individual cells as shown in the image):
|
1 2 3 4 |
import pandas as pd #read csv file into data using pandas read_csv method data = pd.read_csv('Movie_Revenue_Edited.csv') data |
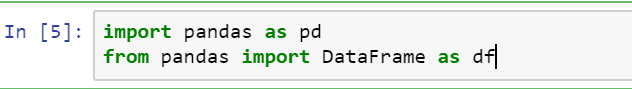
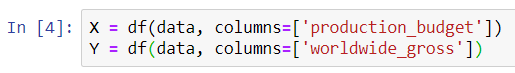
The next step is to load the data into the X and Y axis for the plot. X is going to be production_budget and Y will contain the worldwide_gross from the datasheet. To serve this purpose, you will have to map the csv data into rows and columns. This can be achieved using Pandas Data Frame. Data Frames is a two-dimensional and heterogeneous tabular data structure with labelled axes, i.e., rows and columns. The data frames package must be imported before using them in the code, which is very similar to the way you import packages in JAVA and C#. Go back to the cell where you imported the Pandas library and add the new from line. After adding the code, rerun the cell.
|
1 2 |
import pandas as pd from pandas import DataFrame as df |
Now to get the data loaded into the X and Y axes, you will load the data frame with production_budget and Y-axis with worldwide_gross. Make sure you provide the same column name as that of your input csv data. The code will look something like this:
|
1 2 |
X = df(data, columns=['production_budget']) Y = df(data, columns=['worldwide_gross']) |
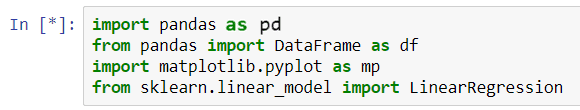
Now that you have successfully separated the data, you can visualise it. For this, you will need to import another module called Matplotlib. It has a rich library of graphing and plotting functionality. You will use the pyplot feature from this module. Just add the import statement to import the correct module. Make sure that you hit the Run button whenever you write new code to execute the cell’s code.
|
1 2 3 |
import pandas as pd from pandas import DataFrame as df import matplotlib.pyplot as mp |
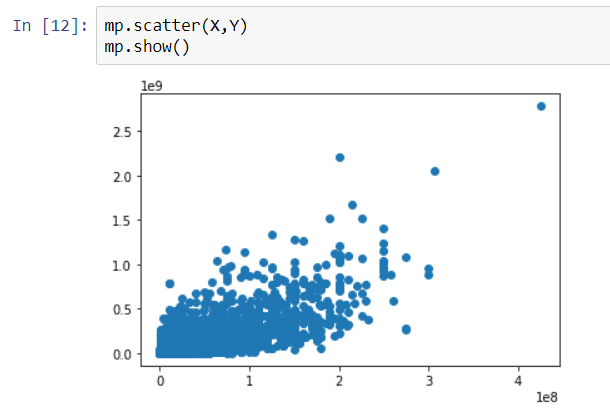
In a new cell, you will write code to print the plot. You will use Scatter Plots here as they help you find the correlation between these two variables. To display the plot, you will use the pyplot.show() method.
|
1 2 |
mp.scatter(X,Y) mp.show() |
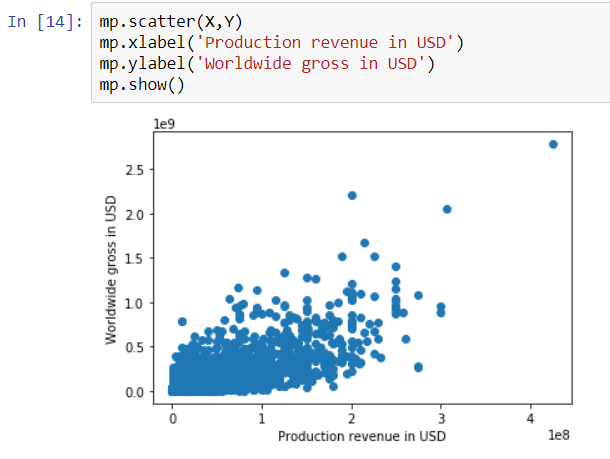
To make the chart more readable, annotate the X and Y axes. This can be done using pyplot’s xlabel and ylabel methods.
|
1 2 3 4 |
mp.scatter(X,Y) mp.xlabel('Production revenue in USD') mp.ylabel('Worldwide gross in USD') mp.show() |
Train the algorithm
Now you can run the regression on the plot to analyse the results. The main goal here is to achieve a straight line or the line of predicted values that would act as a reference to analyse any future predictions. As you might have realised by now, there are several modules that provide different functionality. To run the regression, you will use Scikit-learn which is a very popular machine learning module. Back in the import cell, add the new line to import linear regression from the Scikit-learn module and rerun.
|
1 2 3 4 |
import pandas as pd from pandas import DataFrame as df import matplotlib.pyplot as mp from sklearn.linear_model import LinearRegression |
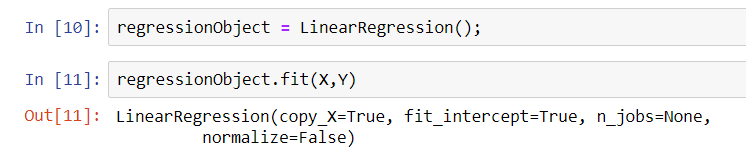
Scikit-learn helps you create a linear regression model. Since the task of running the linear regression is done by an object, you will need to create a new object, in this case with the name regressionObject. The Fit method can be used to fit the regression model to the data. In other words, you have to make the model learn using the training data. For this purpose, use the fit method as shown below.
|
1 2 |
regressionObject = LinearRegression(); regressionObject.fit(X,Y) |
Once your model is trained with the training dataset, you can predict the value for Y using the regression object. The predict method will help you predict values for Y for each X.
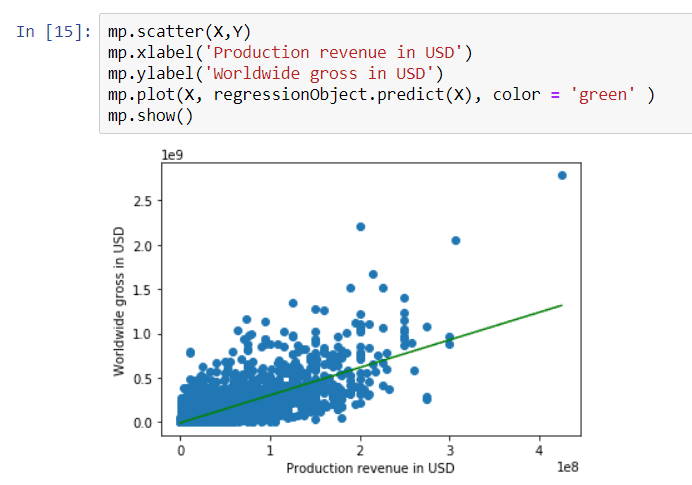
So yPredicted will be equal to regressionObject.predict(X), and then yPredicted is used to build the regression line onto the plot using this statement. You will notice that I have used the green colour for the regression line, which shows up in the plot successfully. Change the previous cell so that it includes the plot.
|
1 2 3 4 5 |
mp.scatter(X,Y) mp.xlabel('Production revenue in USD') mp.ylabel('Worldwide gross in USD') mp.plot(X, regressionObject.predict(X), color = 'green') mp.show |
Analyse
As you can see from the plot, there is a positive relationship between the two values. As production revenue increases, there is an increase in worldwide gross. This means the rate of change of variable Y is proportional to the change in X. When the regression line is linear the equation of line is Y = aX + b, the a is the regression coefficient/slope of the line which signifies the variance of Y with change in values of X.
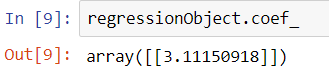
The positive regression coefficient (a) will tell you that there is a positive relationship between X and Y. The coefficient value can be determined using coef_ property on the regression object. For this map, the regression coefficient is 3.11, which means that for each USD spent for the movie production, you should get $3.11 in return.
|
1 |
regressionObject.coef_ |
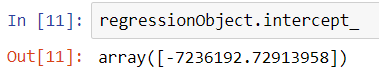
The next step is to calculate b the intercept_ of the line. This can be done by using intercept_ property on the regression object.
|
1 |
regressionObject.intercept_ |
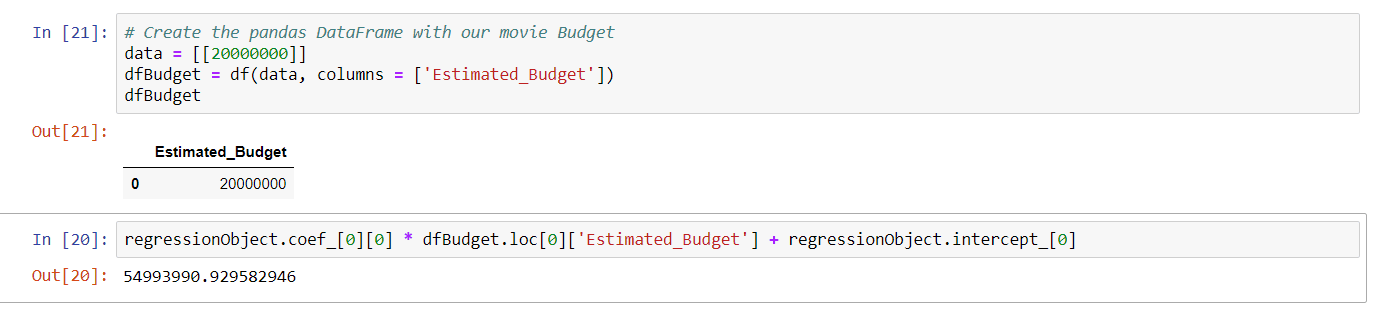
The generalized formula for a line is Y = aX + b. Now consider a hypothetical scenario where you want to predict the worldwide revenue that a movie made for $20 Million in production budget. The estimation can be found by substituting the values in the equation.
|
1 2 |
Y = 3.11150918 * 20,000,000 + (-7236192.72913958) Y = 54,993,990.87086042 |
The above calculation can be done using the Python notebook as below:
|
1 2 3 4 5 6 |
# Create the pandas DataFrame with our movie Budget data = [[20000000]] dfBudget = df(data, columns = ['Estimated_Budget']) dfBudget regressionObject.coef_[0][0] * dfBudget.loc[0]['Estimated_Budget'] + regressionObject.intercept_[0] |
The important thing to note here is the model is a hypothetical analysis of the data provided. The predictions are not 100% accurate, but there is a high possibility that the predictions would turn out to be true. Keep in mind that the model is a dramatic simplification of the real world.
Summary
This article provided an introduction to the concepts of machine learning, data science and linear regression. It demonstrated how to build and analyse the Machine Learning Linear Regression Model through various steps which will eventually enabled you to predict the outcome for practical problems.
References
https://hackernoon.com/the-ai-hierarchy-of-needs-18f111fcc007
https://towardsdatascience.com/linear-regression-detailed-view-ea73175f6e86
http://www.data-analysis-in-python.org/
Load comments