


Investigating problems with ad-hoc queries using SQL Monitor
Phil Factor demonstrates the performance problems that overuse of ad-hoc queries can cause and then how SQL Monitor can warn us when they are the cause of these problems on your SQL Servers, using built-in metrics such as SQL Compilations/sec metric and Batch Requests/sec.
There is nothing wrong with the principle of using ad-hoc queries; one can use them occasionally and perfectly legitimately. However, when ad-hoc queries run as part of a processes that does database operations iteratively, row-by-agonizing-row, they can be one of the most unremitting ways of sapping the performance of a SQL Server instance. You need a range of weapons to hunt down this sort of error problem.
Often, unfortunately, the ill-treatment occurs only intermittently, and follows no distinct pattern of behaviour. There will be a sudden, seemingly-random burst of ad-hoc queries that puts too much load on the server and causes resource contention.
Their effects are obvious, but only if you spot them with a monitor or profiler. To catch and diagnose these issues, reliably, you’ll need baselines for various resource metrics, so you can plot them over a range of periods. This is where a tool like SQL Monitor can help.
Ad-Hoc queries, set-based queries, prepared statements and parameterised queries
The most common way to abuse ad-hoc queries is to use them in an occasional iterative process, such as a cursor or any other “row by agonizing row” (RBAR) process. Iteration may be great in Java, but it is inefficient in SQL, which is intrinsically set-based, and works better if you think that way.
To illustrate this, imagine you have a Person table.
|
1 2 3 4 5 6 7 8 9 10 11 12 13 14 15 16 17 18 19 20 21 22 |
IF NOT EXISTS (SELECT 1 FROM INFORMATION_SCHEMA.TABLES WHERE TABLES.TABLE_NAME LIKE 'Person') CREATE TABLE dbo.Person (Person_id INT IDENTITY(1, 1) NOT NULL, ContactTitle VARCHAR(50) NOT NULL CONSTRAINT DF_Person_ContactTitle DEFAULT(''), Title VARCHAR(20) NOT NULL CONSTRAINT DF_Person_Title DEFAULT(''), FirstName NVARCHAR(50) NOT NULL CONSTRAINT DF_Person_FirstName DEFAULT(''), NickName NVARCHAR(50) NOT NULL CONSTRAINT DF_Person_NickName DEFAULT(''), LastName NVARCHAR(50) NOT NULL CONSTRAINT DF_Person_creator DEFAULT(User_Name()), DateOfBirth DATETIME NULL, insertiondate DATETIME NULL CONSTRAINT DF_Person_insertiondate DEFAULT(GetDate()), terminationdate DATETIME NULL, CONSTRAINT PK_dbo_Person PRIMARY KEY CLUSTERED(Person_id ASC) WITH(PAD_INDEX = OFF, STATISTICS_NORECOMPUTE = OFF, IGNORE_DUP_KEY = OFF, ALLOW_ROW_LOCKS = ON, ALLOW_PAGE_LOCKS = ON) ON [PRIMARY]) ON [PRIMARY]; |
Listing 1
We now fill it with 20,000 rows of fake data to simulate part of a Customer database. If you have SQL Data Generator, right click on the Person table to launch it. Alternatively, the AdHocSQLCode download includes a Person.txt file, which you can import using the Import Flat File Wizard in SSMS (in which case, you don’t need to run Listing 1).
Now, imagine we have a cub programmer who is tasked with putting the assembled names (first name, middle name, last name) of all these people into a table, perhaps for the purposes of a mailshot.
Iteration with a dynamic ad-hoc query
Listing 2 shows a classic iteration. For each value of @id, it hard codes that value into a ‘dynamic SQL’ string, which fetches the corresponding row from the Person tables, concatenates the title, first name and last name fields, and inserts the row into the #name table, then it simply passes the string into the EXECUTE command. SQL Server will have to compile a new plan for every iteration, since the SQL text we pass in is different every time.
|
1 2 3 4 5 6 7 8 9 10 11 12 13 14 15 16 17 18 19 |
--drop the table if it exists and create it IF Object_Id('tempdb..#names') IS NOT NULL DROP TABLE #names; CREATE TABLE #names (name VARCHAR(80)); /*A simple loop through a table, with each iternation looking for a particular name in a "Person" table, assuming that a programmer is making the simple mistake of using procedural code*/ DECLARE @ii INT; DECLARE @IterationsToDo INT = 20000; DECLARE @id VARCHAR(8); SELECT @ii = 1; WHILE @ii <= @IterationsToDo BEGIN SELECT @ii = @ii + 1, @id = Convert(VARCHAR(5), @ii); EXECUTE('insert into #names (name) Select Title + '' ''+Firstname+ '' ''+Lastname from person where person_ID=' + @id); END; |
Listing 2
OK, you may not believe it, but I’ve seen it, often from an ORM or from an application widget, which adopts this technique of simply passing in dynamic SQL strings to execute, instead of parameterizing the SQL within the application. Often developers will do an iterative process within the application and mistakenly do a SQL call from the depths of all the nested loops.
Code Smell, BP013
Executing a SQL batch in a string using EXECUTE (string) is a code smell that will be flagged by both SQL Monitor and SQL Prompt.
In my tests, this took 39s, on average, to run. “Stap me vitals!”, you exclaim, “at least use a parameterised query.’
Iteration with parameterized dynamic SQL
Here, we use the sp_executesql procedure to pass parameters to the dynamic SQL. In this case, SQL Server first compiles the batch, sets the values of any variables, and then runs the EXEC command. Therefore, the optimizer compiles a parameterized string, and then ‘sniffs’ the parameter values at runtime.
|
1 2 3 4 5 6 7 8 9 10 11 12 13 14 15 |
DECLARE @ii INT; DECLARE @IterationsToDo INT = 20000; SELECT @ii = 1; WHILE @ii <= @IterationsToDo BEGIN SELECT @ii = @ii + 1; /* the first time that the sp_executesql statement is executed, SQL Server generates a parameterized plan for the SELECT statement from person with id as the parameter. For all subsequent executions, SQL Server reuses the plan with the new parameter value */ EXEC sp_executesql N' insert into #names (name) Select Title + '' ''+Firstname+ '' ''+Lastname from person where person_ID=@id', N'@id int', @id = @ii; END; |
Listing 3
The optimizer creates a plan for the first iteration, then reuses it 19999 times. This query runs over five times faster than the previous one; seven seconds instead of thirty-nine seconds.
Iteration with a prepared statement
You can also limit the damage by using a prepared statement, which will tell the Query Optimiser unequivocally that you want to reuse the plan.
|
1 2 3 4 5 6 7 8 9 10 11 12 13 14 15 16 17 18 |
DECLARE @ii INT; DECLARE @IterationsToDo INT = 20000; DECLARE @P1 INT; SELECT @ii = 1; EXEC sp_prepare @P1 OUTPUT, N'@Id INT', N'insert into #names (name) Select Title + '' ''+Firstname+ '' ''+Lastname from person where person_ID=@Id'; WHILE @ii <= @IterationsToDo BEGIN SELECT @ii = @ii + 1; EXEC sp_execute @P1, @ii; END; EXEC sp_unprepare @P1; |
Listing 4
Iteration with a ‘raw’ ad-hoc query
Listing 5 avoids use of dynamic SQL, and simply uses an iterative approach to execute a raw ad-hoc query.
|
1 2 3 4 5 6 7 8 9 10 11 12 13 |
DECLARE @ii INT; DECLARE @IterationsToDo INT = 20000; DECLARE @id VARCHAR(8); SELECT @ii = 1; WHILE @ii <= @IterationsToDo BEGIN SELECT @ii = @ii + 1, @id = Convert(VARCHAR(5), @ii); INSERT INTO #names(name) SELECT Title + ' ' + FirstName + ' ' + LastName FROM Person WHERE Person_id = @id; END; |
Listing 5
You may expect results similar to what we saw for Listing 2, because we’re once again submitting to SQL Server a string that changes for each iteration, according to the value of @id. In fact, though, our example query is simple enough that the optimizer recognizes that parameterizing it would enable it to create an execution plan that can be cached and reused, without risk. Therefore it “auto-parameterizes” the query, replacing the “literal” values for Person_id with a parameter.
Unless you force it to do otherwise, the optimizer will only use this ‘Simple Parameterization’ technique for a relatively small range of low-risk, simple queries where it can be certain that one plan will work well with the full range of possible parameters. The presence of joins, aggregation, subqueries, and many other clauses, will discourage it.
The set-based approach
Only the first approach, running ad-hoc queries as dynamic SQL strings, performs terribly, although use of raw ad-hoc SQL will be just as bad, were the query any more complex. Use of ExecuteSQL or prepared statements limits the damage, by enforcing parameterization and plan reuse, but these are still slow performers. Slow? Oh yes, because it should have been done by a simple set-based query.
|
1 2 |
INSERT INTO dbo.#names(name) SELECT Title + ' ' + FirstName + ' ' + LastName FROM dbo.Person; |
Listing 6
Now we get one execution plan that returns all the required results, and that will be cached and reused.
How each query performed
The code download for the article includes a simple test harness (AdHocSQLTestHarness.sql) that captures the timings for all the different ad-hoc queries discussed above. Every test starts with a cold buffer cache, as if I was shutting down and restarting the server, which is achieved by running a CHECKPOINT followed by a DBCC DROPCLEANBUFFERS. I’ve then removed all elements from the plan cache with a DBCC FREEPROCCACHE.
So, here is a summary of the relative performance of these queries.

Basically, doing it properly is thirty times faster than the best way of doing it iteratively, where the cached plan for the first iteration is reused for subsequent ones. If you don’t reuse the cached plan, then you are doomed to something that is one hundred and eighty times slower.
All the iterative approaches have the same execution plan; the optimizer chooses to seek the clustered index to retrieve the row corresponding to the current @id value, concatenates all the name elements then insert the row into the #names table.

For the iterations with ExecuteSQL, prepared statements, and the raw ad-hoc query, the optimizer compiles the plan and then reuses it, for each subsequent iteration. If you use the SET STATISTICS IO ON/OFF command to capture the IO metrics for the query, each of these approaches causes about 60K logical reads.
The ad-hoc dynamic strings floods the plan cache with 20K single-use copies of the same plan, and it’s all the extra work associated with compiling and storing theses plans that causes the poor performance. However, STATISTICS IO will still show 60K logical reads because it ‘hides’ this extra work. If we use Extended Events (capturing the sql_batch_completed event), then we’ll see all the work done directly by the query, and the extra work on behalf of the query, like the work related to plan compilation. Measured with Extended Events, we see about 60K logical reads for the iterative approaches that reuse the plan, but over 220K logical reads for the one that doesn’t; that’s an extra 160K logical reads, related to plan cache management.
For the set-based approach, we see just one execution plan, with a scan of the clustered index to return all the rows in one pass, and then the Compute Scalar and Table Insert, as above. It performs just 710 logical reads!
Measuring the costs in resources using PerfMon
Writing lots of ‘single use’ cached plan takes up space, wastes resources and cause contention, and a common way to investigate resource “queues” is to track various Performance Monitor (PerfMon) counters.
PerfMon is a Windows OS monitoring tool that provides a vast range of counters for monitoring memory, disk, CPU and network usage on a server, but also many SQL Server performance counters. However, which PerfMon counters might indicate to us that ad hoc queries are causing these problems? Let’s look!
A useful technique is to capture the values of some of these counters before and after the “crime” occurs. On a quiet database, where I’m the only user, I’ll clear the cache, take a snapshot of the values for various SQL Server PerfMon counters, run the “ad-hoc dynamic strings” query, take a second snapshot, and then just list the counters whose values changed by more than 30 percent. As we can see, the log write waits, and the counts for SQL Plans increase enormously.

If we clear the plan cache and re-run the test with a prepared statement, in the same test-harness, we see a much lower use of cache resources but many more log writes.

SQL Monitor captures a lot of these PerfMon counters for us at regular intervals, making it very easy to plot “before” and “after” graphs for certain counters, although it doesn’t by default capture any of the Plan Cache counters.
Hunting SQL and Object plans using the DMOs
If you detect plan cache bloat, you’ll need some tools to investigate the plans in the cache, and their associated queries.
Object Plans are those that are generated by creating a routine such as a stored procedure, function, or trigger. SQL Plans are query plans that are produced from all these types of ad hoc Transact-SQL query. This will include auto-parameterized queries, user-parameterized queries, and statements prepared using sp_prepare or sp_cursorprepare. If the optimizer recognizes the SQL text for a submitted query is identical to text it has seen before, with the same SET options and database_id, it will reuse a cached plan.
The sys.dm_exec_cached_plans DMV stores the plan_handle, which uniquely identifies the cached query plan for a batch or stored procedure that has been executed, and the DMV also contains detailed information about each cached plan, such as the type of plan, the number of times it has been used, and its size. We supply the plan_handle as a parameter to the sys.dm_exec_sql_text function to extract the specific SQL text associated with a plan, as shown in Listing 7, where we see the cached plans, with the highest use counts listed first. To see some of the queries that never get reused, just switch the order to ASC.
|
1 2 3 4 5 |
SELECT TOP 10 ThePlans.usecounts, QueryText.text FROM sys.dm_exec_cached_plans AS ThePlans CROSS APPLY sys.dm_exec_sql_text(ThePlans.plan_handle) AS QueryText WHERE ThePlans.cacheobjtype = 'Compiled Plan' ORDER BY ThePlans.usecounts DESC; |
Listing 7
For example, here is the SQL Text for the cached plan for our prepared statement:
(@Id INT)insert into #names (name) Select Title + ' '+Firstname+ ' '+Lastname from person where person_ID=@Id
If you want to find out the ratio of single-use to multi-use cached plans, on your SQL Server instance, then the query in Listing 8 is very handy, because it does the analysis per database.
|
1 2 3 4 5 6 7 8 |
SELECT Db_Name(QueryText.dbid) AS database_name, Sum(CASE WHEN ThePlans.usecounts = 1 THEN 1 ELSE 0 END) AS Single_use, Sum(CASE WHEN ThePlans.usecounts > 1 THEN 1 ELSE 0 END) AS Reused, Sum(ThePlans.size_in_bytes) / (1024 * 1024) AS Mb FROM sys.dm_exec_cached_plans AS ThePlans CROSS APPLY sys.dm_exec_sql_text(ThePlans.plan_handle) AS QueryText WHERE ThePlans.cacheobjtype = 'Compiled Plan' AND QueryText.dbid IS NOT NULL GROUP BY QueryText.dbid; |
Listing 8
Another approach is to use the sys.dm_exec_query_stats DMV, which stores aggregated execution statistics for any queries that have cached execution plans. It returns one row for every query statement in a cached plan. Many of the columns are incremented counters, and provide information about how many times a query has been executed and the resources that were used.
Listing 9 uses the plan_generation_num column to identify the SQL text queries whose plans are getting the most recompiles.
|
1 2 3 4 5 6 7 |
SELECT TOP 50 Query_Stats.plan_generation_num, Query_Stats.execution_count, QueryText.text FROM sys.dm_exec_query_stats AS Query_Stats CROSS APPLY sys.dm_exec_sql_text(Query_Stats.sql_handle) AS QueryText WHERE Query_Stats.plan_generation_num > 1 AND text NOT LIKE '%--RedGateIgnore%' ORDER BY Query_Stats.plan_generation_num DESC; |
Listing 9
Hunting for when the crime is committed using SQL Monitor
It’s perfectly normal for the plan cache to contain some plans that are used frequently and others very few times, or even only once. The cache is very efficiently managed, one can use ad-hoc SQL occasionally and perfectly legitimately. However, ad-hoc queries use resources unnecessarily and, in some cases, can force SQL Server to eject important but perhaps infrequently executed plans from the cache.
So, let’s see if we can use SQL Monitor to tell us when the system is being stressed with Ad-Hoc SQL. Here we are on the analysis page, and viewing the analysis graph for the Compilations/sec SQL Server metric.

You see high compilations per second either when the server is unable to cache plans long enough in memory, or is being inundated with brand-new queries.
This SQL Compilations/sec metric is best used together with Batch Requests/sec and you’ll be happy if SQL Compilations/sec are less than ten percent of the total Batch Requests/sec.
To see the spikes in ad-hoc SQL, the Compilations/batch metric (SQL compilations per batch requests received) is therefore a better reference. Our test database is quiet, other than the SQL monitoring going on, so the Compilations/batch graph for the same period looks eerily similar.

You can check to see if this activity is unusual by just hitting the baseline button and see if this is something that happens the same time every day or week or month, and whether this occurrence is any way ‘abnormal’ compared to normal workload activity.
However, here I’m cheating. All I’ve been doing to generate this activity is periodically run the dynamic ad-hoc SQL script (Listing 1), each time starting from a cold buffer cache and empty plan cache.
Every time I clear the cache and run that pesky RBAR iteration, the plan cache fills up with 20000 plans. Remember that if there are no cached plans to start with, then the plan for one of our ad-hoc dynamic SQL queries, such as…
insert into #names (name) Select Title + ' '+Firstname+ ' '+Lastname from person where person_ID=2546
…will only get reused on subsequent executions of the same loop, when it the optimizer reaches that same @id value of 2546.
Now, I’ll quit cheating and create an artificial simulation of real use by looping through all these tests at random intervals of between one and ten minutes (the code download includes a few scripts to simulate this behavior).
Here’s the graph showing the compilation and batch request metrics.
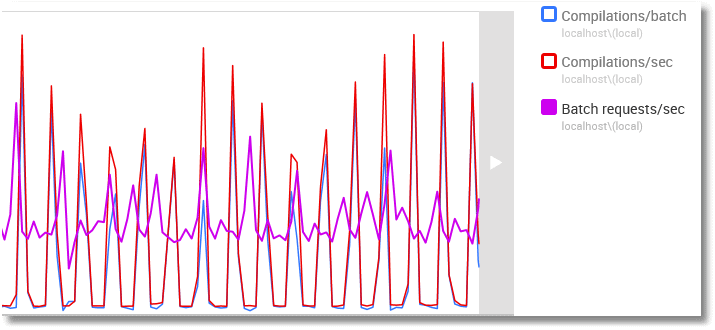
I was somewhat expecting to see these initial spikes tail off, once the compilations cease because the plan cache holds cached plans for all possible parameter values, but it seems that the compilation counters are incremented even if the query enters the compilation process, but is satisfied by an existing cached plan.
You can see that plan reuse is happening by running a query to list some of the cached queries. Listing 10 simply adds a filter to Listing 7, so we only see plans involving our test SQL.
|
1 2 3 4 5 |
SELECT TOP 10 ThePlans.usecounts, QueryText.text FROM sys.dm_exec_cached_plans AS ThePlans CROSS APPLY sys.dm_exec_sql_text(ThePlans.plan_handle) AS QueryText WHERE QueryText.text LIKE '%person%' ORDER BY ThePlans.usecounts DESC; |
Listing 10
Those cached RBAR queries we saw have now been reused, and so no recompilations are taking place. The top query is the parameterized query that has been used 120,000 times. 
If your plan cache is big enough, and your SQL requirements prosaic enough, you can accommodate all these plans in such a way that they get reused and the increase eventually tails off to nothing. It is just when you get severe and unnecessary iteration that it becomes a bother.
In cases where there seem to be a lot of these single-use plans around, Listing 11 shows an exploratory query that will tell you what similar queries are in cache and how often they have been used.
|
1 2 3 4 5 6 7 |
SELECT TOP 10 Count(*) AS [number in Cache], Sum(deqs.execution_count) AS [total reuse], deqs.query_hash, Max(dest.text) AS text FROM sys.dm_exec_query_stats AS deqs CROSS APPLY sys.dm_exec_sql_text(deqs.sql_handle) AS dest GROUP BY deqs.query_hash ORDER BY Count(*) DESC; |
Listing 11
Now that we’re clearer about the symptoms of ad-hoc queries, the next stage might be to create a custom metric, to gauge the effects of ad-hoc queries over time, and get a baseline. We can return just a single number to be graphed, so success with this depends on getting the best metric.
Conclusion
There are plenty of ways that applications can unintentionally misuse databases. When the abuses are pervasive, you can often catch them by means of a few deft queries on various Dynamic Management Objects. Likewise, abuses that occur at predictable times are easier to monitor and troubleshoot. I’ve seen many crimes against SQL being committed only at end-of-month reconciliation or reporting.
However, problems caused by ad-hoc queries are often sporadic and unpredictable. A monitoring tool will help a great deal in tracking down the problem. Whether you use SQL Monitor or the SQL Profiler, you certainly need a baseline and an analysis graph that shows your compilations per second. In SQL Monitor, you’ll see spikes in your Analysis -> Compilations/Sec Analysis graph in Monitor, but each spike will die down because subsequent repeats of a loop executed in SQL won’t show up.
Watch for those spikes and see what has changed. It is quite hard to then detect ad-hoc SQL that is filling your cache with seldom-used queries and eating up resources. It is by a combination of tactics that you can track down the offending code, and these tactics will involve looking at cached queries using Dynamic management views and objects, and examining how many times cached plans have been reused. Suddenly, you’ll spot the offending queries and you’ll be sighing and looking around for the culprit. How you fix the problem is going to be interesting, but it is another topic.
Tools in this post
Redgate Monitor
Real-time SQL Server and PostgreSQL performance monitoring, with alerts and diagnostics
You may also like
-

Webinar
Key insights from the 2021 State of Database Monitoring Survey
Join us for insights from Redgate's fourth annual survey on the state of database monitoring. This webinar will dig into key trends in the world of server, instance, and database monitoring, and how database professionals are adapting to these challenges. Over 3,000 database professionals across a range of sectors, in organizations of every size around the globe, told us how they monitor their estates, the technologies they work with, what their biggest challenges are, and what the future trends for the industry are likely to be.
-

Article
Tagging SQL Server Changes in SQL Monitor
How to use RAISERROR() in T-SQL to send annotations to SQL Monitor, so you can observe the direct impact of application tasks, or server changes, on the SQL Server metrics.
-
Article
Tagging in a monitoring tool: what is it and how can it benefit your team?
We recently released a minor version of SQL Monitor, v12.1, that includes two exciting new features: ‘Tagging’ and a ‘Current Activity’ page. Find a post on the latter here. As you start to have responsibility for more than a handful of SQL Server instances, you’ll need to get more organised. Everyone around you benefits if
-
Webinar
The Real-World Challenges of Monitoring Large Estates
Monitoring large database estates requires careful planning and execution to ensure optimal performance, security, and availability. However, a modern data estate is complex and includes many aspects that make this task challenging. Today’s organisations create and accumulate vast amounts of decentralised data scattered across multiple environments. With this comes a relentless growth in the number
-
Forums
Redgate Monitor Forum
Real-time performance monitoring for SQL Server and PostgreSQL, with alerts and diagnostics


